
Double Mass Curve Technique
Enroll to start learning
You’ve not yet enrolled in this course. Please enroll for free to listen to audio lessons, classroom podcasts and take practice test.
Interactive Audio Lesson
Listen to a student-teacher conversation explaining the topic in a relatable way.
Introduction to the Double Mass Curve Technique
🔒 Unlock Audio Lesson
Sign up and enroll to listen to this audio lesson

Today we'll explore the Double Mass Curve Technique, which is crucial for checking the consistency of rainfall records. Why do you think consistent data is important in hydrology?

Because we need accurate rainfall data for modeling and planning!
Exactly! Now, can someone explain what we do in this technique?

We plot cumulative rainfall for a station against the average of nearby stations.
Correct! If the points form a straight line, what does that indicate?

It shows that the data is consistent!
Right! Remember this straight-line concept; it’s a key point. How can we interpret a change in slope?

That could mean there's an inconsistency, maybe due to equipment changes.
Great observation! Let's keep these ideas in mind as we dive deeper.
Steps in the Double Mass Curve Technique
🔒 Unlock Audio Lesson
Sign up and enroll to listen to this audio lesson

Now that we understand the theory, let’s look at the steps involved. What do you think the first step is?
Plotting the cumulative rainfall data?
Yes! We start with that. We’ll use data from a target station compared to nearby ones. What comes next?
Drawing a line through the points?
Good! A straight line shows consistency. But what if there's a curvature?
Then we need to investigate what caused it!
Exactly! You’ll want to analyze the reasons for that inconsistency. Remember, investigating data changes can prevent future errors.
Applications of Double Mass Curve
🔒 Unlock Audio Lesson
Sign up and enroll to listen to this audio lesson
How do you think using the Double Mass Curve could impact hydrologic studies?
It helps ensure the reliability of the data we use.
Absolutely! Can anyone think of a specific application?
Maybe in flood forecasting?
Yes, precisely! Reliable data supports better flood prediction and resource management. Remember, consistency leads to trustworthiness in our analyses!
Introduction & Overview
Read summaries of the section's main ideas at different levels of detail.
Quick Overview
Standard
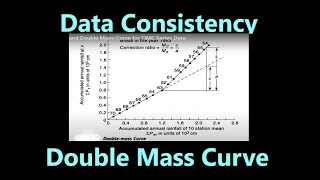
This technique involves plotting cumulative rainfall data for a specific station against that of neighboring stations. A linear relationship indicates consistency, while changes in slope indicate possible inconsistencies in the data, emphasizing the importance of verifying rainfall records before use.
Detailed
The Double Mass Curve Technique is an essential method used in hydrology to evaluate the reliability of rainfall data before applying it in calculations for areal mean precipitation. The core principle involves plotting the cumulative rainfall of a target station against the average cumulative rainfall from surrounding stations. A straight-line trend from this plot signifies consistent and reliable rainfall data, which is critical for accurate hydrological assessments. Any deviations or changes in the slope of the curve can suggest inconsistencies, often attributed to changes in the location of the rainfall station or the equipment used for measurements. This technique is vital to ensure that the long-term rainfall data is dependable, thereby facilitating accurate hydrological modeling and water resource planning.
Youtube Videos


Audio Book
Dive deep into the subject with an immersive audiobook experience.
Introduction to Double Mass Curve Technique
Chapter 1 of 3
🔒 Unlock Audio Chapter
Sign up and enroll to access the full audio experience
Chapter Content
This technique is used to check the consistency of rainfall records before using them in areal mean calculations.
Detailed Explanation
The Double Mass Curve Technique is a valuable method for ensuring the reliability of rainfall data. Before we can accurately calculate average rainfall over an area, it is essential to confirm that the records from different rain gauge stations are consistent and reliable. This technique utilizes cumulative rainfall data from a target station and compares it with the average cumulative rainfall from neighboring stations.
Examples & Analogies
Imagine you are baking a cake and comparing the measurements of different ingredients from various people who have made the same recipe. If one person consistently reports a lot more flour than the others, it raises a red flag about their measurements. Similarly, the Double Mass Curve Technique helps us identify any 'outliers' in rainfall data that could skew our overall calculations.
Steps Involved in the Technique
Chapter 2 of 3
🔒 Unlock Audio Chapter
Sign up and enroll to access the full audio experience
Chapter Content
Steps:
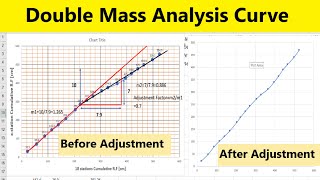
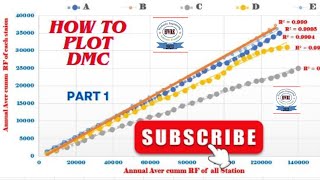
1. Plot cumulative rainfall at a target station against the average of neighboring stations.
2. A straight-line trend indicates consistent data.
3. A change in slopes suggests inconsistency, possibly due to changes in station location or equipment.
Detailed Explanation
The process begins with plotting the cumulative rainfall amounts from the chosen target station and the average rainfall from nearby stations on a graph. If the plotted graph shows a straight line, it indicates that the data is consistent over time. Conversely, if the graph begins to deviate into different slopes, it indicates potential inconsistencies in the data. This could be due to various reasons such as the station being relocated or problems with measurement equipment, which could affect the accuracy of the data.
Examples & Analogies
Think of a teacher who records the scores of students over several tests. If the scores from a particular student show a sudden drop or spike compared to their usual performance and that of others, it might flag an issue with the test's fairness or the student's understanding. In the Double Mass Curve Technique, when we see these changes in trend, we know we need to investigate the cause of inconsistency.
Uses of the Double Mass Curve Technique
Chapter 3 of 3
🔒 Unlock Audio Chapter
Sign up and enroll to access the full audio experience
Chapter Content
Use:
• Corrects data inconsistencies.
• Ensures reliability of long-term rainfall data.
Detailed Explanation
The Double Mass Curve Technique serves two primary purposes. First, it helps in identifying and correcting any inconsistencies in rainfall data by highlighting anomalies. Second, ensuring that the rainfall data is reliable over the long term allows hydrologists and engineers to make better planning and management decisions related to water resources, such as estimating runoff and designing water infrastructure.
Examples & Analogies
Imagine a scientist who is studying climate change and needs accurate temperature records from various years. If one of the records shows an unusually low temperature due to a malfunctioning thermometer, it could distort their analysis. Using a method similar to the Double Mass Curve Technique, they could validate and correct this data, ensuring their research is based on accurate historical climate information.
Key Concepts
-
Consistency of Rainfall Data: Consistent data is essential for accurate hydrological analysis.
-
Cumulative Rainfall Plotting: The technique involves plotting cumulative rainfall of a target station against that of neighboring stations.
-
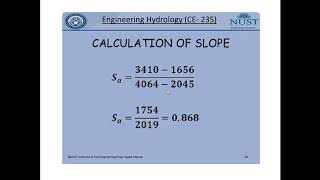
Slope Interpretation: Changes in the slope of the plot indicate data inconsistencies that require investigation.
Examples & Applications
If a target station's cumulative rainfall data shows a curve when plotted against neighboring stations, this might indicate that the station had maintenance issues affecting measurements.
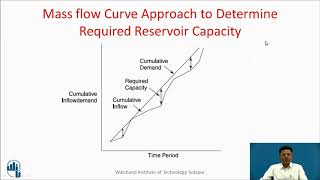
Evaluating cumulative rainfall records before designing a reservoir ensures that water supply predictions are based on reliable data.
Memory Aids
Interactive tools to help you remember key concepts
Rhymes
If the curve is straight and tight, your rainfall records are just right!
Stories
Imagine a fisherman trusting the weather. If he spots a straight raincurve, he knows it's safe to sail. If the curve changes, he starts over to check his sources!
Memory Tools
C-S-S: Consistent data creates a Straight line. Slope changes signal a need for investigation!
Acronyms
DMC
Double Mass Curve
to Determine Mapped Consistency.
Flash Cards
Glossary
- Double Mass Curve
A graphical representation used to assess the consistency of two sets of cumulative rainfall data.
- Cumulative Rainfall
The total rainfall recorded over a specific time period.
- Slope Change
A deviation in the gradient of the data plot, indicating potential inconsistencies in the data collected.
Reference links
Supplementary resources to enhance your learning experience.