
Methods for Estimating Mean Precipitation
Enroll to start learning
You’ve not yet enrolled in this course. Please enroll for free to listen to audio lessons, classroom podcasts and take practice test.
Interactive Audio Lesson
Listen to a student-teacher conversation explaining the topic in a relatable way.
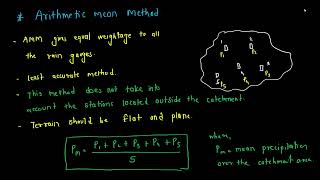
Arithmetic Mean Method
🔒 Unlock Audio Lesson
Sign up and enroll to listen to this audio lesson

Let's start discussing the Arithmetic Mean Method. This method is quite simple and best used when rainfall is relatively uniform across the area. Can anyone tell me how we calculate it?

I think we just average the rainfall amounts at each station?
Exactly! We sum up the rainfall from all stations and divide by the number of stations. It can be expressed as P mean equals the sum of P i divided by n. What do you think is a limitation of this method?

Maybe it wouldn’t work well if rainfall varies a lot between the stations?
Correct! The Arithmetic Mean fails to account for significant rainfall variations. Remember this as a key limitation. Can we outline its advantages?

It's quick and easy, right?
Yes, it requires minimal data as well. A great acronym to remember the advantages is 'Q.E.D': Quick, Easy, Minimal data! So, in summary, use the Arithmetic Mean when rainfall is consistent. Let's move to the next method!
Thiessen Polygon Method
🔒 Unlock Audio Lesson
Sign up and enroll to listen to this audio lesson

Now, let’s move on to the Thiessen Polygon Method. Can someone explain the basic idea behind this method?
Is it about giving weight to stations based on their location?
That's right! This method divides the area into polygons, with each polygon representing the rainfall distribution around a particular station. What are the steps involved in this method?
We plot the stations and create triangles between them, right?
Exactly! After that, we create perpendicular bisectors to form polygons. Each polygon area gets assigned a weight based on its size relative to the total area. What’s the formula to compute the mean precipitation in this method?
Is it something like P mean equals the sum of 'w times P' for all stations?
Spot on! One of the advantages is that it accounts for gauge location, but what do you think is a major drawback?

It assumes uniform rainfall inside each polygon, which might not be true?
Exactly! So, we learned that while it’s better for non-uniform areas, it can still misrepresent rainfall in certain situations. Let's summarize: the method enhances accuracy by taking spatial distribution into account.
Isohyetal Method
🔒 Unlock Audio Lesson
Sign up and enroll to listen to this audio lesson
Now, let’s delve into the Isohyetal Method. Why do we consider this the most accurate method?
Because it accounts for variations in rainfall over small distances?
Correct! It uses isohyets to represent lines of equal rainfall. Who can summarize the steps to use this method?
First, we plot the rainfall data on a map, then draw the isohyets through interpolation, right?
Yes! After you create the isohyets, we divide the areas between them and compute the average precipitation for each belt. What about the formula for this?
I remember it as P mean equals the sum of A times P for all zones!
Exactly right! However, the method does require some expertise in mapping. Can anyone think of a situation where this method might be particularly beneficial?
It seems perfect for areas with complex topography where rainfall is very variable!
Great observation! To conclude, this method is very precise but comes with a cost of data and skill. Remember, for varied rainfall, the Isohyetal Method stands out!
Comparison of Methods
🔒 Unlock Audio Lesson
Sign up and enroll to listen to this audio lesson
Now that we've covered the methods, let’s compare them. Which method would you recommend for varying rainfall and why?
The Isohyetal Method! It accounts for rainfall variability, so it’d give the best estimate.
Good point! Now, what about for uniform rainfall?
The Arithmetic Mean Method would be ideal because it’s simple and effective in that case.
Exactly! The Thiessen Method is a good middle ground for moderate variability. It’s essential to consider gauge distribution too. So what will help determine which method to choose?
The terrain features like topography and the number of gauges!
Exactly! Geographic factors and gauge placement are crucial for accuracy. In summary, remember the context—use the right method, and it will enhance your analysis of mean precipitation.
Application of Methods
🔒 Unlock Audio Lesson
Sign up and enroll to listen to this audio lesson
Lastly, let’s talk about the application of these methods. In what scenarios do you think estimating mean precipitation is vital?
For flood forecasting and planning water resource projects!
Exactly! Accurate mean precipitation helps inform runoff volumes. What else can it impact?
It would also be crucial for irrigation planning and assessing droughts!
You're right! So, it affects agricultural planning directly. The accuracy of these estimates plays a significant role in hydrological modeling and long-term water resource management. To wrap up, what have we learned today about choosing the right method for estimating mean precipitation?
We need to consider rainfall variability and gauge density to choose the best approach.
Absolutely! Selecting the appropriate estimation technique is key to effective water resource management. Excellent work today!
Introduction & Overview
Read summaries of the section's main ideas at different levels of detail.
Quick Overview
Standard
In this section, we explore three primary methods of estimating mean precipitation over an area. The Arithmetic Mean is useful for uniform rainfall, the Thiessen Polygon method offers weighted averages based on proximity to rain gauges, while the Isohyetal method provides high accuracy for variable rainfall patterns. Each method has its advantages and limitations.
Detailed
Methods for Estimating Mean Precipitation
Estimating mean precipitation over an area is crucial for hydrological planning and engineering applications. This section focuses on three principal methods:
1. Arithmetic Mean Method
This is the simplest method suitable for areas with uniform rainfall. It involves calculating the mean precipitation across several stations:
- Formula:
P ext{mean} = rac{1}{n} imes ext{sum of } P_i ext{ (P at each station)}
Advantages: Quick and requires minimal data processing.
Limitations: Not recommended for areas with significant rainfall variation and disregards spatial arrangement of stations.
Youtube Videos

Audio Book
Dive deep into the subject with an immersive audiobook experience.
Introduction to Mean Precipitation Estimation Methods
Chapter 1 of 4
🔒 Unlock Audio Chapter
Sign up and enroll to access the full audio experience
Chapter Content
There are three principal methods commonly used for estimating the mean precipitation over an area:
Detailed Explanation
This sentence introduces the three main methods used for estimating mean precipitation, which are essential for hydrological studies and water resource management. These methods vary in complexity and applicability based on geographic and meteorological conditions.
Examples & Analogies
Think of estimating mean precipitation like trying to find the average temperature in a large city with several neighborhoods. Just as you can't rely on a single thermometer reading in one neighborhood, you can't use just one rain gauge to understand the average rainfall in a broad area.
Arithmetic Mean Method
Chapter 2 of 4
🔒 Unlock Audio Chapter
Sign up and enroll to access the full audio experience
Chapter Content
8.3.1 Arithmetic Mean Method
This is the simplest method and is suitable when rainfall is fairly uniform over the area.
Formula:
\[ P_{mean} = \frac{1}{n} \sum_{i=1}^{n} P_i \]
Where:
• P = Rainfall at station i
• n = Number of rain gauge stations
Advantages:
• Simple and quick.
• Requires minimal data processing.
Limitations:
• Not reliable when rainfall varies significantly across the area.
• Does not account for the spatial arrangement of stations.
Detailed Explanation
The Arithmetic Mean Method calculates the average rainfall by simply adding up the rainfall amounts recorded at multiple stations and dividing by the number of stations. This method is best when the rainfall is even across the area, making it easy to calculate. However, it becomes less accurate if the rain varies widely from place to place and doesn’t consider where each gauge is located relative to one another.
Examples & Analogies
Imagine you are averaging the scores of students in a school exam. If every student scored similarly, you’d get a reliable average score. But if some students scored very high while others scored very low, the average might misrepresent the true performance of the class.
Thiessen Polygon Method
Chapter 3 of 4
🔒 Unlock Audio Chapter
Sign up and enroll to access the full audio experience
Chapter Content
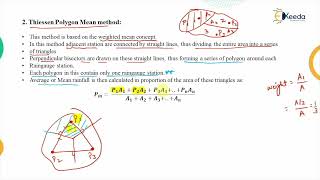
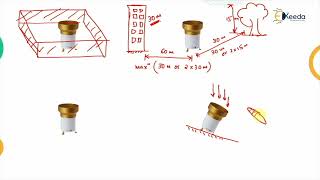
8.3.2 Thiessen Polygon Method
This is a weighted average method based on the proximity of each rain gauge station to different areas of the basin.
Steps Involved:
1. Plot the location of all rain gauge stations on a map.
2. Connect adjacent stations to form a network of triangles.
3. Draw perpendicular bisectors of each side to form polygons.
4. Each polygon area is assumed to be represented by the station it contains.
5. Compute the weighted average based on polygon area.
Formula:
\[ P_{mean} = \sum_{i=1}^{n} w_i P_i \]
Where:
• w = Weight = Area of polygon around station i / Total area
• P = Rainfall at station i
Advantages:
• Accounts for spatial location of rain gauges.
• More accurate than the arithmetic mean in non-uniform rainfall.
Limitations:
• Assumes rainfall is uniform within a polygon.
• Laborious to construct manually for many stations.
Detailed Explanation
The Thiessen Polygon Method involves creating polygons around each rain gauge based on their positions to represent different areas of the catchment. Because it factors in the spatial arrangement of the stations, it offers a more accurate average rainfall estimate for areas with uneven rainfall distribution. However, one limitation is that it assumes rainfall is uniform within each polygon, which might not always be the case.
Examples & Analogies
Consider a farmer with different plots of land. If each plot has a sensor measuring soil moisture, the farmer can average the moisture content more accurately using polygons around the sensors tailored to each plot's size and shape, rather than just taking a simple average of all readings.
Isohyetal Method
Chapter 4 of 4
🔒 Unlock Audio Chapter
Sign up and enroll to access the full audio experience
Chapter Content
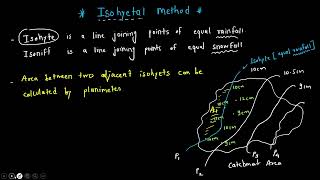
8.3.3 Isohyetal Method
This is the most accurate and widely used method, especially for regions with high spatial variability in precipitation.
Steps Involved:
1. Plot the rainfall values on a map.
2. Draw isohyets (lines of equal rainfall) through interpolation.
3. Divide the area between successive isohyets.
4. Compute the average precipitation in each belt between isohyets.
5. Multiply each average by the area it represents and sum them.
Formula:
\[ P_{mean} = \sum_{i=1}^{m} (A_i \cdot P_i) \]
Where:
• A = Area between two isohyets
• P = Average precipitation in that area
• A = Total area
• m = Number of isohyetal zones
Advantages:
• Most accurate among all methods.
• Considers both magnitude and spatial variation of rainfall.
Limitations:
• Requires considerable data and mapping skill.
• Time-consuming and requires topographical interpretation.
Detailed Explanation
The Isohyetal Method uses isohyets—lines connecting points of equal rainfall—to depict spatial variations in precipitation. By breaking the area into bands between these lines and estimating average rainfall in each band, this method provides the most accurate estimates for variable rainfall conditions. However, developing isohyets requires sophisticated mapping skills and significant data, making it more complex and time-consuming than the other methods.
Examples & Analogies
Think of a weather map showing temperatures in different regions. Each line connects areas with the same temperature (isotherms), similar to isohyets for rainfall. This method helps us precisely see where temperatures change, allowing for more informed decisions, like knowing which areas need more heating in winter.
Key Concepts
-
Arithmetic Mean: A method for calculating the mean precipitation assuming uniform rainfall.
-
Thiessen Polygon Method: A method considering the location of rain gauges through spatial weighting.
-
Isohyetal Method: A precise method utilizing isohyets for variable rainfall analysis.
Examples & Applications
Using the Arithmetic Mean Method, if three stations report 10 mm, 12 mm, and 14 mm of rain, the mean precipitation would be (10 + 12 + 14) / 3 = 12 mm.
In an area using the Thiessen Polygon Method, if the gauge distribution is uneven, areas closer to some gauges will have more influence on the mean rainfall than those further away.
Memory Aids
Interactive tools to help you remember key concepts
Rhymes
For rainfall that's uniform, mean is a breeze; to balance out rain, 'Arithmetic' is the tease!
Stories
Imagine you have three thirsty plants at different spots. You want to know how much water they each get on average under a consistent rain. Using the Arithmetic Mean, you just tally and divide, making them happy with even care.
Memory Tools
Think 'P.A.W' for precipitation analysis weights in Thiessen - Proximity, Area, Weighting - helps remember its approach!
Acronyms
ISO highlights Inspection, Study, Optimum for variances, capturing dynamic rainfall in detailed patterns.
Flash Cards
Glossary
- Areal Mean Precipitation
The average precipitation over a specific area, calculated using various methods.
- Arithmetic Mean
A simple average of rainfall at different gauges used when rainfall is uniform.
- Thiessen Polygon Method
A method that weights rainfall averages according to the area of polygons around gauges.
- Isohyetal Method
A method involving interpolation of isohyets to estimate rainfall over complex areas.
Reference links
Supplementary resources to enhance your learning experience.