
Mean Precipitation Over an Area
Enroll to start learning
You’ve not yet enrolled in this course. Please enroll for free to listen to audio lessons, classroom podcasts and take practice test.
Interactive Audio Lesson
Listen to a student-teacher conversation explaining the topic in a relatable way.
Importance of Estimating Areal Mean Precipitation
🔒 Unlock Audio Lesson
Sign up and enroll to listen to this audio lesson

Let's begin our discussion on mean precipitation by emphasizing its vital role in hydrology. Can anyone tell me why it's important to understand precipitation over an area rather than at a single point?

I think it's because rain varies across different areas, especially in larger regions?
Exactly! Since precipitation tends to be spatially variable, especially over large catchments, we need an average to understand its impact on runoff and reservoir management. How do you think we can achieve this?

Using multiple rain gauge stations can help get a better average?
Yes, having multiple stations provides data representative of the area. This helps in flood forecasting and irrigation planning. Always remember, precipitation data is essential for hydrological modeling.

So, it’s critical for planning. What factors actually affect rainfall distribution across areas?
Great question! Factors such as topography, wind patterns, and storm characteristics all influence how precipitation is distributed. Keep these in mind as we move forward!
To recap: Mean precipitation is crucial for managing water resources effectively, especially in flood and drought assessments.
Methods for Estimating Mean Precipitation
🔒 Unlock Audio Lesson
Sign up and enroll to listen to this audio lesson

Now, let’s explore the various methods for estimating mean precipitation. Who can explain the Arithmetic Mean Method?

It’s the simplest method where you just take the average of all measured precipitation from the stations, right?
Correct! However, what do you think its limitation might be?
It wouldn’t work well if rainfall varies a lot across the area?
Exactly! In cases of variation, we can use the Thiessen Polygon Method. Student_3, how does that method work?
It creates polygons around gauge stations to give weight to their geographic relevance?
Well put! And while this technique is more accurate, it can be labor-intensive. Finally, the Isohyetal Method is the most accurate. Who wants to summarize its process?
We need to plot isohyets and calculate average precipitation within those zones, right?
Yes! Always remember that while it’s the most accurate, it requires more data and skills. So, we have multiple methods, and each has its use case dependent on the variability of precipitation.
To summarize, we covered three estimation methods: the Arithmetic Mean, the Thiessen Polygon, and the Isohyetal Method, each with its advantages and limitations.
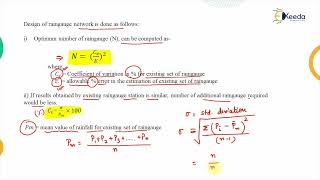
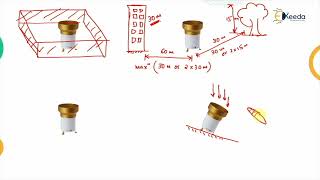
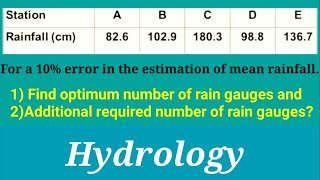
Optimum Number of Rain Gauges
🔒 Unlock Audio Lesson
Sign up and enroll to listen to this audio lesson
Next, let’s talk about how to determine the optimum number of rain gauges needed for accurate mean precipitation estimation. Why is it essential to find an optimal number?
If we have too few, the estimate might be inaccurate, but if we have too many, it might not be cost-effective?
Exactly! Balancing cost and accuracy is crucial. The formula can help determine the optimal number based on rainfall variability. What do you recall as the factors that go into that formula?
The coefficient of variation and the allowable percentage error?
Spot on! This ensures that we maintain accuracy while keeping costs manageable. It’s essential for efficient network design of rain gauges.
Finally, let’s recap: the optimum number of gauges is determined by a trade-off between data accuracy and installation costs, with specific formulas to guide the decision.
Introduction & Overview
Read summaries of the section's main ideas at different levels of detail.
Quick Overview
Standard
The estimation of mean precipitation over an area is crucial for effective water resource management. This section outlines the need for areal precipitation estimates, factors affecting rainfall distribution, and details three key methods for calculating mean precipitation, including their advantages and limitations.
Detailed
Mean Precipitation Over an Area
This section covers the need for estimating mean precipitation across an area, primarily for effective water resource planning like flood forecasting and reservoir design. Individual rain gauge measurements are insufficient due to the spatial variability in rainfall, necessitating the use of methods to calculate areal mean precipitation. The section details factors affecting precipitation distribution, including topography and storm characteristics, which complicate this task. Three primary methods for estimating mean precipitation are presented:
1. Arithmetic Mean Method: Suitable for uniform rainfall, simple and quick, but less reliable with significant variations.
2. Thiessen Polygon Method: Considers the spatial arrangement of gauges but is labor-intensive.
3. Isohyetal Method: Most accurate, especially for varied distributions, but requires significant data and skills. The selection of the appropriate method depends on the area’s characteristics and gauge distribution. Furthermore, it addresses the optimum number of rain gauges for accuracy and introduces the Double Mass Curve Technique to ensure data consistency. Finally, the section highlights the application of these estimates in hydrological studies and practical considerations regarding errors.
Youtube Videos


Audio Book
Dive deep into the subject with an immersive audiobook experience.
Importance of Estimating Areal Mean Precipitation
Chapter 1 of 6
🔒 Unlock Audio Chapter
Sign up and enroll to access the full audio experience
Chapter Content
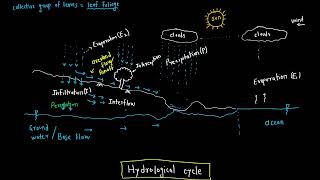
• Precipitation recorded at rain gauge stations represents point data.
• Hydrological models and water balance studies require areal averages.
• Areal precipitation is used in:
– Estimation of runoff volumes.
– Flood forecasting and reservoir design.
– Irrigation planning and drought assessment.
• Due to topographic, climatic, and spatial variability, a uniform distribution of rainfall over a large area is unlikely.
Detailed Explanation
Estimating the average precipitation over a specific area is crucial because rainfall can vary widely across different locations. Rain gauge stations provide point data, which means they only capture the rainfall at a single spot. However, to effectively manage water resources—like designing reservoirs or predicting floods—hydrologists need to know the average rainfall for an entire watershed or area. This average helps in calculating the total runoff, making informed decisions about irrigation, and addressing potential drought conditions.
Examples & Analogies
Think of it like making a soup. If you only taste one spoonful from one spot in the pot, you might miss how salty or flavorful the entire soup is. By sampling from different areas of the soup, you get a much better idea of its overall taste. Similarly, by estimating average rainfall over an entire area rather than relying on a single station, hydrologists get a more accurate picture of water availability.
Factors Influencing Rainfall Distribution
Chapter 2 of 6
🔒 Unlock Audio Chapter
Sign up and enroll to access the full audio experience
Chapter Content
Several factors influence the spatial distribution of precipitation:
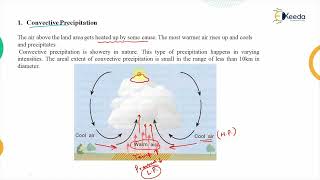
• Topography: Mountains and valleys affect orographic lifting and precipitation concentration.
• Wind patterns and direction: Influence the location and intensity of storms.
• Storm characteristics: Duration, intensity, and movement determine precipitation patterns.
• Rain gauge network density and placement: Sparse or uneven networks lead to inaccurate estimates.
Detailed Explanation
Several natural and logistical factors affect how rainfall is distributed over an area. For instance, mountains can cause clouds to release precipitation on the windward side (where the clouds rise), while the leeward side might receive much less rain—a phenomenon known as orographic lifting. Additionally, the direction and speed of wind impact where storms develop and move. Storms come with varying durations and intensities, which also play a role in how much rain falls in a given area. Lastly, how rain gauges are placed can influence rainfall estimates; if rain gauges are unevenly distributed or sparse, the data collected may not accurately reflect the actual rainfall across the area.
Examples & Analogies
Imagine trying to predict the amount of soda spilled at a party. If you only check one spot next to the soda fountain, you might think there's barely any spill. But if guests spill soda all around the room, you'd need to check multiple spots to gauge the total mess accurately. Similarly, the arrangement and number of rain gauges help hydrologists get a complete picture of rainfall distribution.
Methods for Estimating Mean Precipitation
Chapter 3 of 6
🔒 Unlock Audio Chapter
Sign up and enroll to access the full audio experience
Chapter Content
There are three principal methods commonly used for estimating the mean precipitation over an area:
8.3.1 Arithmetic Mean Method
This is the simplest method and is suitable when rainfall is fairly uniform over the area.
Formula:
Pmean = (1/n) * Σ(Pi)
Where:
• Pi = Rainfall at station i
• n = Number of rain gauge stations
Advantages:
• Simple and quick.
• Requires minimal data processing.
Limitations:
• Not reliable when rainfall varies significantly across the area.
• Does not account for the spatial arrangement of stations.
Detailed Explanation
The Arithmetic Mean Method is one way to calculate the average rainfall in an area. It involves simply adding up the rainfall data from all rain gauge stations and then dividing by the number of stations. This method works best in areas where rainfall is relatively uniform throughout. However, if the area experiences significant variations in rainfall—like areas with both very wet and very dry places—this method can give misleading results because it doesn't consider how the gauges are spread out.
Examples & Analogies
Think of arithmetic mean like averaging scores between students in a class. If everyone scores similarly, the average accurately reflects performance. But if one student scores extremely low while others do very well, that one low score can skew the average down, making it look like the whole class performed poorly. Similarly, in rainfall data, one gauge in a dry area can lower the average even if other areas received much more rain.
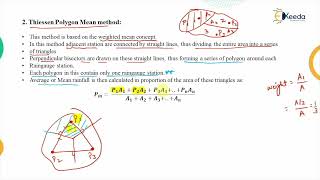
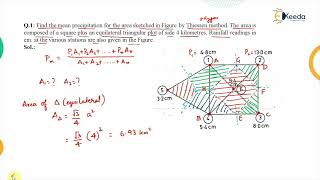
Thiessen Polygon Method
Chapter 4 of 6
🔒 Unlock Audio Chapter
Sign up and enroll to access the full audio experience
Chapter Content
This is a weighted average method based on the proximity of each rain gauge station to different areas of the basin.
Steps Involved:
1. Plot the location of all rain gauge stations on a map.
2. Connect adjacent stations to form a network of triangles.
3. Draw perpendicular bisectors of each side to form polygons.
4. Each polygon area is assumed to be represented by the station it contains.
5. Compute the weighted average based on polygon area.
Formula:
Pmean = Σ(wi * Pi)
Where:
• wi = Weight = Area of polygon around station i / Total area
• Pi = Rainfall at station i
Detailed Explanation
The Thiessen Polygon Method improves upon the Arithmetic Mean by considering the spatial location of rain gauges. By creating polygons around each gauge based on their proximity to one another, this method assigns more weight to gauges closer to specific areas, which helps provide a more accurate average for those regions. The amount of area each polygon covers is also factored in when calculating the overall average rainfall.
Examples & Analogies
Consider a pizza with various topping slices. If you give more importance to slices that are larger (like parts of the pizza with more toppings), you'd need to weigh them differently when averaging out how much of a certain topping is on the pizza. Similarly, the Thiessen method calculates averages by taking into account how much area each rain gauge influences, giving you a more accurate average rainfall for the whole area.
Isohyetal Method
Chapter 5 of 6
🔒 Unlock Audio Chapter
Sign up and enroll to access the full audio experience
Chapter Content
This is the most accurate and widely used method, especially for regions with high spatial variability in precipitation.
Steps Involved:
1. Plot the rainfall values on a map.
2. Draw isohyets (lines of equal rainfall) through interpolation.
3. Divide the area between successive isohyets.
4. Compute the average precipitation in each belt between isohyets.
5. Multiply each average by the area it represents and sum them.
Formula:
Pmean = (1/A) * Σ(Ai * Pi)
Where:
• Ai = Area between two isohyets
• Pi = Average precipitation in that area
Detailed Explanation
The Isohyetal Method uses rainfall data to draw lines (called isohyets) that connect points of equal rainfall on a map. This allows for a more precise representation of how rainfall varies across a landscape. By dividing the area into sections based on these isohyets, the average rainfall can be calculated more accurately, taking into account variations across different regions of the area being studied.
Examples & Analogies
Imagine you're trying to gauge temperatures on a varied landscape with hills and valleys. Instead of just looking at one thermometer, you draw lines between points that show the same temperature, allowing you to visualize how temperatures change across the area. The Isohyetal Method does just this for rainfall data—creating a clearer understanding of where rain falls more and where it falls less.
Choosing the Right Method
Chapter 6 of 6
🔒 Unlock Audio Chapter
Sign up and enroll to access the full audio experience
Chapter Content
Condition | Preferred Method
Uniform rainfall and evenly distributed gauges | Arithmetic Mean
Uneven distribution of gauges, moderate variation | Thiessen Polygon
High variability in rainfall, complex terrain | Isohyetal Method
Factors to consider while choosing a method:
• Size and topography of the area.
• Distribution and number of rain gauges.
• Availability of contour data and rainfall records.
Detailed Explanation
Choosing the right method for estimating mean precipitation depends on specific conditions of the area. For example, when rainfall is consistent across an area with well-placed gauges, the Arithmetic Mean method works well. However, in situations with uneven rainfall distribution or complex landscapes, the Thiessen Polygon or Isohyetal methods are more appropriate. Key factors influencing this choice include the size of the area, the topography, how many rain gauges are present, and the availability of additional data like topographic maps.
Examples & Analogies
When baking a cake, you choose your recipe based on the ingredients you have and the size of your cake pan. Similarly, in hydrology, you select a method to estimate mean precipitation based on the specific characteristics of the area and the data available.
Key Concepts
-
Mean Precipitation: The average rainfall computed over a specified area.
-
Areal Mean Estimation: Techniques needed to determine average rainfall using multiple gauge readings.
-
Spatial Variability: The differences in rainfall across various regions due to geographical factors.
Examples & Applications
When analyzing a watershed area for agricultural development, hydrologists use the Isohyetal Method to determine the average rainfall, accounting for uneven distribution across the basin.
In flood forecasting, the Thiessen Polygon Method may be employed where rain gauges are strategically placed to ensure the areas they cover are representative of local rainfall patterns.
Memory Aids
Interactive tools to help you remember key concepts
Rhymes
Precipitation’s key, it's not just in sight, mean it must be, for planning right!
Stories
Imagine a valley with rain gauges on the peaks. Each gauge tells a story of the rainfall, but only when together do they sing the true song of the area.
Memory Tools
Remember the 'Three M's of Precipitation Methods': Mean, Method, Measurement.
Acronyms
AREAM - Average Rainfall Estimation and Measurements.
Flash Cards
Glossary
- Mean Precipitation
The average amount of rainfall over a specified area, calculated from multiple point measurements.
- Areal Precipitation
The average precipitation calculated over a larger area instead of at a single point.
- Arithmetic Mean Method
A basic method for calculating mean rainfall where all measured values are summed and divided by the number of measurements.
- Thiessen Polygon Method
A method that weights rain gauge readings by the area they cover, using geometric polygons.
- Isohyetal Method
An advanced method that uses contour lines to visually represent regions of equal rainfall, providing a more accurate average.
- Optimum Number of Gauges
The ideal number of rain gauges to install for the most accurate mean precipitation calculations within a budget.
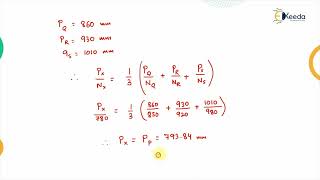
- Double Mass Curve
A technique used to check the consistency of precipitation data across different stations.
Reference links
Supplementary resources to enhance your learning experience.