
Calculation of Correlation Coefficient
Enroll to start learning
You’ve not yet enrolled in this course. Please enroll for free to listen to audio lessons, classroom podcasts and take practice test.
Interactive Audio Lesson
Listen to a student-teacher conversation explaining the topic in a relatable way.
Introduction to the Correlation Coefficient
🔒 Unlock Audio Lesson
Sign up and enroll to listen to this audio lesson

Today, we're going to explore the correlation coefficient. Can anyone tell me what the correlation coefficient measures?

Isn't it something like how strongly two variables are related?
Exactly! It's a numerical value that indicates the strength and direction of a relationship between two variables. What's the range of values it can take?

From -1 to 1!
Right! A value close to 1 indicates a strong positive correlation, while a value close to -1 means a strong negative correlation. What do you think a value near 0 represents?

That means there’s no correlation.
Great job! Let's remember that with this simple phrase: 'Zero means no partner - they're not linked at all!'
Raw Data Formula
🔒 Unlock Audio Lesson
Sign up and enroll to listen to this audio lesson

Now, let's move on to how we can calculate the correlation coefficient using raw data. Who remembers the formula?

Is it something like \( r = \frac{n(\sum xy) - (\sum x)(\sum y)}{\sqrt{[n(\sum x^2) - (\sum x)^2][n(\sum y^2) - (\sum y)^2]}} \)?
Yes! Excellent recall! Let's break it down. What does 'n' stand for?
It represents the total number of pairs of data, right?
Correct! And what about the summations? Why are they important?
They help us calculate the total values necessary for the formula.
Exactly! So remember, the more precise your sums, the better your correlation coefficient! 'Sum it up, or your results will be tough!'
Grouped Data Formula
🔒 Unlock Audio Lesson
Sign up and enroll to listen to this audio lesson
Now, let’s talk about grouped data. Can anyone provide the formula we would use?
It’s \( r = \frac{N(\sum fxy) - (\sum fx)(\sum fy)}{\sqrt{[N(\sum fx^2) - (\sum fx)^2][N(\sum fy^2) - (\sum fy)^2]}} \).
Exactly! Who can tell me what 'f' stands for in this context?
It represents the frequency of the data points!
Great job! And why do we need to consider the frequencies in this situation?
Because we need to account for how often each data point appears to get an accurate correlation.
Fantastic! Remember, 'Frequency counts - it’s what amounts!'
Applications of Correlation Coefficient
🔒 Unlock Audio Lesson
Sign up and enroll to listen to this audio lesson
Now that we understand how to calculate the correlation coefficient, let’s discuss its applications. Where might we use this in real life?
I think it could be used in finance to see if two stocks move together.
Or in health sciences, to see if there's a relationship between exercise and weight loss!
Exactly! Correlation analysis is widely used across various fields to interpret relationships. Understanding these concepts helps us in data-driven decision making. 'Find the link, and you won't sink!'
Review and Key Takeaways
🔒 Unlock Audio Lesson
Sign up and enroll to listen to this audio lesson
Let’s summarize what we learned about calculating the correlation coefficient. Who can remind me of the two methods we discussed?
Using raw data and using grouped data formulas!
Correct! And what’s the significance of knowing how to calculate it?
It helps us understand the strength and direction of relationships between variables!
Exactly! Always remember to check your sums! 'A good sum leads to a good run!'
Introduction & Overview
Read summaries of the section's main ideas at different levels of detail.
Quick Overview
Standard
The calculation of the correlation coefficient can be carried out using different formulas for both raw data and grouped data. Understanding how to apply these methods enables students to assess the correlation between variables effectively.
Detailed
Calculation of Correlation Coefficient
In this section, we delve into the methods used to calculate the correlation coefficient, a vital statistical tool that quantifies the strength and direction of the relationship between two quantitative variables. The correlation coefficient, represented by 'r', ranges from -1 to 1. A value close to 1 indicates a strong positive correlation, while a value close to -1 indicates a strong negative correlation, and a value around 0 suggests no correlation.
Methods of Calculation
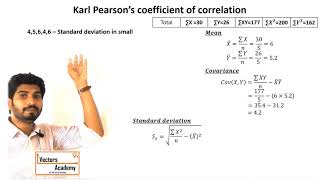
- Using Raw Data Formulas: The correlation coefficient can be calculated directly from raw data using the formula:
\[ r = \frac{n(\sum xy) - (\sum x)(\sum y)}{\sqrt{[n(\sum x^2) - (\sum x)^2][n(\sum y^2) - (\sum y)^2]}} \]
In this formula:
- 'n' is the total number of paired scores,
- 'x' and 'y' are the individual sample points.
- \( \sum \) signifies summation for the respective variable.
- Using Grouped Data Formulas: In cases where data is grouped, the formula is adapted to account for the group frequencies:
\[ r = \frac{N(\sum fxy) - (\sum fx)(\sum fy)}{\sqrt{[N(\sum fx^2) - (\sum fx)^2][N(\sum fy^2) - (\sum fy)^2]}} \]
Where \(f\) represents the frequency of each grouped data point, and \(N\) is the total number of observations.
Understanding these equations is crucial for practical applications in statistics, enabling students to perform correlation analysis and interpret relationships between various datasets effectively.
Youtube Videos


Audio Book
Dive deep into the subject with an immersive audiobook experience.
Methods of Calculation
Chapter 1 of 1
🔒 Unlock Audio Chapter
Sign up and enroll to access the full audio experience
Chapter Content
Methods to calculate the correlation coefficient include:
● Using raw data formulas.
● Using grouped data formulas.
Detailed Explanation
In this chunk, we discuss the two primary methods used to calculate the correlation coefficient. The first method involves using raw data formulas, which directly use the individual data points to compute the correlation. The second method employs grouped data formulas, which are used when data is summarized into groups or classes, making it easier to analyze larger datasets.
Examples & Analogies
Imagine you are a student tracking the number of hours you study and your scores on tests. You can calculate the correlation between your study hours and test scores directly using individual data points (raw data), or you might summarize your study hours into categories like 0-2 hours, 3-5 hours, etc. (grouped data) to see trends more clearly.
Key Concepts
-
Correlation Coefficient: A measure that quantifies the relationship between two variables.
-
Raw Data Formula: The formula for calculating correlation from unprocessed data.
-
Grouped Data Formula: The method used to find correlation when data is presented in groups.
Examples & Applications
Example 1: If we have pairs of data points (x,y): (1,2), (2,4), (3,6), we can calculate the correlation coefficient to find that there is a strong positive correlation.
Example 2: In a grouped data scenario where the number of hours studied and grades received are evaluated, we can determine how correlated those two sets of data are using the grouped data formula.
Memory Aids
Interactive tools to help you remember key concepts
Rhymes
For correlation that is strong, positive or negative, know where they belong!
Stories
Imagine two friends, A and B, who either always hang out together or never! The closer their scores in friendship grow, the closer they move together as a correlation should show!
Memory Tools
To remember the correlation coefficient formula: 'Naughty Kids Like Sweet Treats' - Numbers (N), K (Sum x'y'), L (Sum x), S (Sum y), T (Sum x²), and T (Sum y²).
Acronyms
R=S/F for Remembering correlation relations - where S is sums in the formula, and F is frequency factor!
Flash Cards
Glossary
- Correlation Coefficient
A numerical measure of the strength and direction of a linear relationship between two variables.
- Raw Data
Unprocessed data collected in its original form before processing or analysis.
- Grouped Data
Data that has been compiled and summarized into groups or categories.
- Summation (Σ)
The process of adding a sequence of numbers; the symbol Σ denotes summation.
- Frequency (f)
The number of occurrences of a particular data point within a dataset.
Reference links
Supplementary resources to enhance your learning experience.