
Types of Correlation
Enroll to start learning
You’ve not yet enrolled in this course. Please enroll for free to listen to audio lessons, classroom podcasts and take practice test.
Interactive Audio Lesson
Listen to a student-teacher conversation explaining the topic in a relatable way.
Positive Correlation
🔒 Unlock Audio Lesson
Sign up and enroll to listen to this audio lesson

Today, we're learning about positive correlation. Can anyone explain what it is?

Is it when both variables increase together?
Exactly! A positive correlation means that as one variable goes up, the other does too. Can anyone think of an example?

When a student studies more, their grades usually improve.
Great example! To remember this, think of 'Positive = Plus = Both go up!'

So, what if one goes down?
That's a great question! If one variable goes down and the other goes down too, that’s still positive correlation. Let’s move to negative correlation.

What makes it negative?
When one variable increases while the other decreases, just like when the temperature rises and the heating demand goes down. Remember, 'Negative = Nega = One goes down!'
So, can you give a summary?
Sure! Positive correlation happens when both variables increase or decrease together. It’s represented as a direct relationship between the two variables.
Negative Correlation
🔒 Unlock Audio Lesson
Sign up and enroll to listen to this audio lesson

Now, let's dive into negative correlation. Who can tell me what it is?
It’s when one variable increases and the other decreases.
Correct! It represents an inverse relationship. Can anyone think of a practical example of this?
If I run faster, I will take less time to reach my goal, which means I have less time.
Exactly! Remember: 'Negative = Nega = One goes up, the other goes down!' It's a powerful concept for analyses!
How is this useful in research?
Negative correlation can help in predicting trends, such as economic indicators. Let's summarize this!
So we learned that negative correlation shows an inverse relationship?
Exactly! One goes up, the other goes down.
No Correlation
🔒 Unlock Audio Lesson
Sign up and enroll to listen to this audio lesson
Let’s now consider no correlation. Who can explain what it means?
It means there's no consistent relationship between the two variables?
Absolutely right! Two variables might change without affecting each other. Can you think of an example?
The color of a car and its mileage?
Perfect! The two characteristics have no relationship. Remember: 'No correlation = No connection!'
So, how do these correlations help us?
These correlations help in analyzing data trends to make informed decisions. Understanding when variables are correlated or not is essential!
Can you summarize all types?
Sure! We discussed positive correlation, where both variables move together; negative correlation, where one increases and the other decreases; and no correlation, signifying no relationship.
Introduction & Overview
Read summaries of the section's main ideas at different levels of detail.
Quick Overview
Standard
The section defines and contrasts three types of correlation found in statistics: positive correlation, where both variables move in the same direction; negative correlation, where one variable increases while the other decreases; and no correlation, indicating no discernible relationship between the variables.
Detailed
Types of Correlation
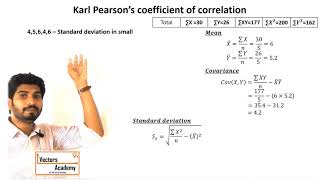
In statistics, correlation is a vital concept that indicates how two variables relate to one another. This section defines three primary types of correlation:
1. Positive Correlation
Positive correlation occurs when both variables increase or decrease together. For example, as study hours increase, so do the grades of students. The relationship reflects a direct association.
2. Negative Correlation
In negative correlation, one variable's increase results in the decrease of the other variable. For instance, as the temperature rises, the demand for heating decreases. This indicates an inverse relationship between the two variables.
3. No Correlation
No correlation indicates that there is no predictable relationship between the two variables. For instance, the height of students does not correlate with their preferences for ice cream flavors.
Understanding these types of correlation is foundational for further analysis in statistics, especially in correlation and regression analysis.
Youtube Videos


Audio Book
Dive deep into the subject with an immersive audiobook experience.
Positive Correlation
Chapter 1 of 3
🔒 Unlock Audio Chapter
Sign up and enroll to access the full audio experience
Chapter Content
Correlation can be:
● Positive Correlation: Both variables increase or decrease together.
Detailed Explanation
Positive correlation occurs when two variables move in the same direction. That means when one variable increases, the other variable also increases. Conversely, if one variable decreases, the other one also decreases. This relationship shows a direct association between the two variables.
Examples & Analogies
Think about the relationship between the amount of study hours and test scores. Generally, if a student studies more hours, their test scores tend to increase. Therefore, we can say that there is a positive correlation between hours studied and test scores.
Negative Correlation
Chapter 2 of 3
🔒 Unlock Audio Chapter
Sign up and enroll to access the full audio experience
Chapter Content
● Negative Correlation: One variable increases as the other decreases.
Detailed Explanation
Negative correlation occurs when one variable increases while the other variable decreases. This indicates an inverse relationship between the two variables, meaning that as one rises, the other falls.
Examples & Analogies
Consider the relationship between the outside temperature and the amount of hot chocolate people consume. On warmer days, fewer people might drink hot chocolate, leading to a negative correlation between temperature and hot chocolate consumption: as temperature rises, consumption decreases.
No Correlation
Chapter 3 of 3
🔒 Unlock Audio Chapter
Sign up and enroll to access the full audio experience
Chapter Content
● No Correlation: No recognizable relationship between the variables.
Detailed Explanation
No correlation indicates that there is no apparent relationship or pattern between two variables. Changes in one variable do not predict changes in the other, meaning they are independent of each other.
Examples & Analogies
Imagine looking at the relationship between the number of books read by students and the number of cars owned by their families. There is no logical connection between how many books a student reads and how many cars their family has—therefore, we can say there is no correlation between these two variables.
Key Concepts
-
Positive Correlation: When both variables move in the same direction.
-
Negative Correlation: When one variable increases as the other decreases.
-
No Correlation: Lack of a relationship between two variables.
Examples & Applications
Example of Positive Correlation: Increased study hours lead to higher test scores.
Example of Negative Correlation: As the amount of rain increases, outdoor picnic attendance tends to decrease.
Example of No Correlation: The color of someone's car does not relate to their birthday.
Memory Aids
Interactive tools to help you remember key concepts
Rhymes
Positive vibes, they rise and shine; negative vibes, they fall in line.
Stories
Imagine two friends, Jack and Jill. When Jack works harder, Jill does better at school (positive correlation), but when Jack stays up late, Jill becomes tired and less productive (negative correlation). Sometimes, they just argue about what to eat, with neither influencing the other (no correlation).
Memory Tools
Remember CORR: 'C' for Correlation, 'O' for One goes up, 'R' for Reverse (negative), 'R' for Random (no correlation)!
Acronyms
P.N.N
for Positive
for Negative
and N for No correlation!
Flash Cards
Glossary
- Positive Correlation
A relationship between two variables where both increase or decrease together.
- Negative Correlation
A relationship where one variable increases while the other decreases.
- No Correlation
A situation where no discernible relationship exists between two variables.
Reference links
Supplementary resources to enhance your learning experience.