
Using raw data formulas
Enroll to start learning
You’ve not yet enrolled in this course. Please enroll for free to listen to audio lessons, classroom podcasts and take practice test.
Interactive Audio Lesson
Listen to a student-teacher conversation explaining the topic in a relatable way.
Introduction to Correlation Coefficient Calculation
🔒 Unlock Audio Lesson
Sign up and enroll to listen to this audio lesson

Today, we're going to learn about how to calculate the correlation coefficient using raw data. This coefficient gives us insight into the relationship between two variables. Can anyone tell me what we mean by 'correlation'?

Doesn't it show how two variables are related?
Exactly! It tells us whether the variables move together or in opposite directions. Now, who can explain why it's important to calculate this coefficient?

It's important because it helps us understand and predict relationships!
Great! Remember, a correlation coefficient can range from -1 to 1. A value close to 1 indicates a strong positive correlation while -1 indicates a strong negative correlation.

What do we do to actually calculate it, though?
Good question! We use specific formulas. Let’s explore the raw data formula for calculating it.
Understanding the Raw Data Formula
🔒 Unlock Audio Lesson
Sign up and enroll to listen to this audio lesson

"The formula for correlation coefficient 'r' using raw data is:
Practical Application of the Formula
🔒 Unlock Audio Lesson
Sign up and enroll to listen to this audio lesson
Let’s apply this with a simple dataset. Consider we have the following pairs of data: (1,2), (2,3), (3,5). Can someone calculate \(\sum x\), \(\sum y\), \(\sum xy\), \(\sum x^2\), and \(\sum y^2\)?
I think \(\sum x = 6\), \(\sum y = 10\), \(\sum xy = 25\), \(\sum x^2 = 14\), and \(\sum y^2 = 34\).
Perfect! Now, if n = 3 for our three pairs, what is 'r'?

Using the formula, I got an 'r' value of about 0.975!
Excellent work! A value close to 1 confirms a strong positive correlation! This means as x increases, y also tends to increase.
Got it! So, we can use this in real-life situations, right?
Absolutely! It’s very useful in fields like economics, biology, and social sciences.
Introduction & Overview
Read summaries of the section's main ideas at different levels of detail.
Quick Overview
Standard
The section details the process of calculating the correlation coefficient from raw data formulas, illustrating the importance of this calculation in understanding relationships between two variables in correlation analysis.
Detailed
Detailed Summary
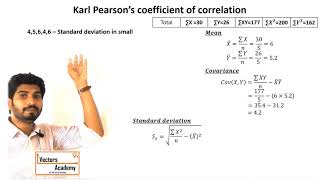
In this section, we explore the calculation of the correlation coefficient using raw data formulas, which is essential in the field of correlation analysis. The correlation coefficient quantifies the degree to which two variables are related, and is represented by 'r'. The formula for r involves the means and standard deviations of the variables, as well as the covariance of the variables. Understanding how to derive and utilize this coefficient allows students and analysts to ascertain the strength and direction of linear relationships effectively. Specifically, the formula for calculating r is as follows:
$$ r = \frac{n(\sum xy) - (\sum x)(\sum y)}{\sqrt{[n\sum x^2 - (\sum x)^2][n\sum y^2 - (\sum y)^2]}} $$
where n is the number of data pairs, \(\sum xy\) is the sum of the product of paired scores, and \(\sum x^2\) and \(\sum y^2\) are the sums of squares of scores. This formula serves as the cornerstone for understanding correlation analysis with raw data.
Youtube Videos


Audio Book
Dive deep into the subject with an immersive audiobook experience.
Introduction to Raw Data Formulas
Chapter 1 of 3
🔒 Unlock Audio Chapter
Sign up and enroll to access the full audio experience
Chapter Content
Raw data formulas are mathematical expressions used to calculate the correlation coefficient directly from ungrouped data points.
Detailed Explanation
Raw data formulas help us compute the correlation coefficient using individual data points, rather than grouped data. This approach is particularly useful when we have a limited dataset, providing an accurate representation of the relationship between two variables. It involves simple statistical calculations including sums and products of the data points.
Examples & Analogies
Imagine you have a small collection of colored marbles, and you want to find out how the weight of each marble relates to its size. Instead of sorting them into groups first, you measure each marble's weight and size individually to analyze the relationship directly.
Components of Raw Data Calculation
Chapter 2 of 3
🔒 Unlock Audio Chapter
Sign up and enroll to access the full audio experience
Chapter Content
To calculate the correlation coefficient using raw data, the following components are required: the mean of each variable, the sum of the product of deviations from the mean, and the standard deviation of each variable.
Detailed Explanation
To compute the correlation coefficient, you'll first find the mean (average) values for each variable. Next, you'll calculate how far each data point deviates from its mean and multiply these deviations together for paired data. Lastly, the sum of these products is divided by the product of the standard deviations of both variables, which normalizes the correlation value to fall between -1 and 1.
Examples & Analogies
Think of baking a cake. You need to gather your ingredients (mean values), measure out the amounts accurately (deviations), mix them together (product of deviations), and then bake it at the right temperature (standard deviations) to ensure it rises perfectly (correlation coefficient).
Final Steps in Raw Data Analysis
Chapter 3 of 3
🔒 Unlock Audio Chapter
Sign up and enroll to access the full audio experience
Chapter Content
After calculating the necessary sums and products, apply the correlation coefficient formula to determine the relationship strength and direction.
Detailed Explanation
Once you've compiled the sums and products as needed, you can apply the correlation coefficient formula: r = (Σ(X - X̄)(Y - Ŷ)) / (n-1) * (σX * σY), where Σ represents the sum, X and Y are your variables, X̄ and Ŷ are the mean values, n is the number of observations, and σX and σY are the standard deviations. This formula gives you a value that ranges from -1 to 1, indicating the strength and direction of the relationship: +1 signifies a perfect positive correlation and -1 implies a perfect negative correlation.
Examples & Analogies
It's like summarizing the results of a survey you conducted. Once you have all the responses tallied (sums and products), you analyze the data using a formula to find the overall trend in opinions (correlation coefficient), which helps you understand how people feel about your topic.
Key Concepts
-
Correlation Coefficient: A measure of the relationship between two variables.
-
Raw Data: Data that hasn't been processed or analyzed.
Examples & Applications
If variable X represents study time in hours and variable Y represents exam scores, a positive correlation indicates that as study time increases, exam scores tend to rise.
In a dataset of height and weight, a negative correlation would indicate that as height decreases, weight may also decrease.
Memory Aids
Interactive tools to help you remember key concepts
Rhymes
When r's near one, two variables run; when it’s negative, they just shun.
Stories
Imagine two friends, X and Y, running in sync on a track: when one speeds up, the other does too. That’s a positive correlation! But if X slows down while Y speeds up, they’re like rivals—a negative correlation.
Memory Tools
Use the acronym 'COV' to remember: C for Correlation, O for the original data (Raw), V for Very important in statistics!
Acronyms
Remember 'PIV' for the correlation formula
for Pairs
for Inputs
and V for Variable relationship.
Flash Cards
Glossary
- Correlation Coefficient
A statistical measure that describes the size and direction of a relationship between two variables.
- Raw Data
Data collected in its original form, which has not been processed or analyzed.
Reference links
Supplementary resources to enhance your learning experience.