
Using grouped data formulas
Enroll to start learning
You’ve not yet enrolled in this course. Please enroll for free to listen to audio lessons, classroom podcasts and take practice test.
Interactive Audio Lesson
Listen to a student-teacher conversation explaining the topic in a relatable way.
Introduction to Grouped Data Formulas
🔒 Unlock Audio Lesson
Sign up and enroll to listen to this audio lesson

Today, we'll learn how to calculate correlation coefficients using grouped data formulas. Why do we need these formulas, you ask?

Isn't it just easier to use raw data all the time?
Good question! While raw data is great for smaller datasets, grouped data is more manageable for larger sets. When we group data, we can summarize it better and still analyze relationships.

Can you give us an example of grouped data?
Sure! Imagine we have the ages of a group of people categorized into ranges like 0-10, 11-20, and so on. We can then apply formulas tailored for this type of data.

So, grouped data helps us simplify calculations?
Exactly! It's about efficiency. Now, let's explore how to compute the correlation coefficient using these formulas.
Group Data Formula for Correlation Coefficient
🔒 Unlock Audio Lesson
Sign up and enroll to listen to this audio lesson

First, let’s understand the grouped data formula for the correlation coefficient. It involves calculating the mean of both variables and finding the covariance.

What's covariance again?
Covariance measures how much two random variables change together. It helps in determining the direction of the relationship. Let's say we have a grouped table with frequencies; we'll compute the sums of products of deviations.
Can you remind us what deviations are?
Of course! Deviations are the differences between each data point and the mean.
So if we have our grouped table, we calculate those deviations, multiply them by frequencies, and sum them up, right?
Exactly! Now, let’s look at an example to illustrate this.
Example Problem
🔒 Unlock Audio Lesson
Sign up and enroll to listen to this audio lesson
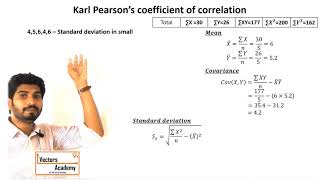
"Let's consider the following grouped data for X and Y:
Introduction & Overview
Read summaries of the section's main ideas at different levels of detail.
Quick Overview
Standard
In this section, we explore the methods to compute the correlation coefficient from grouped data, emphasizing the importance of using frequency distributions to accurately assess correlation in larger datasets. Understanding these formulas allows better interpretation of relationships between variables within categories.
Detailed
Using Grouped Data Formulas
This section focuses on the techniques utilized to calculate the correlation coefficient when dealing with grouped data. Correlation coefficients quantify the strength and direction of a linear relationship between two variables. When data is collected in groups rather than as raw scores, specific formulas become necessary to compute the coefficient accurately. The following grouped data formulas can be employed:
- Frequency Distribution: This involves creating a frequency table that sums the product of deviations from the means of both variables.
- Formulas:
These grouped data methods are particularly useful when it comes to larger sets of data where raw data points are inefficient to handle. Mastery of these formulas is essential for the proper analysis and interpretation of correlations within categorical data.
Youtube Videos


Audio Book
Dive deep into the subject with an immersive audiobook experience.
Introduction to Grouped Data Formulas
Chapter 1 of 3
🔒 Unlock Audio Chapter
Sign up and enroll to access the full audio experience
Chapter Content
Grouped data formulas are used when the data is organized into classes or intervals, allowing for easier computation of correlation coefficients.
Detailed Explanation
When we have a large dataset, it can be cumbersome to deal with each individual data point. Instead, we can organize that data into groups or intervals. For instance, if we are measuring people's heights, we might group them into ranges: 150-159 cm, 160-169 cm, and so on. Grouping makes it simpler to analyze the data since we're summarizing it rather than working with raw values. Using grouped data formulas helps us to find the correlation coefficient based on these summaries.
Examples & Analogies
Imagine you're sorting your fruit collection into boxes by type: apples, bananas, and oranges. Rather than counting each fruit one by one every time, you just note how many boxes you have of each type. This box system simplifies things, just as grouped data formulas simplify complicated datasets.
Steps to Calculate Correlation Coefficient Using Grouped Data
Chapter 2 of 3
🔒 Unlock Audio Chapter
Sign up and enroll to access the full audio experience
Chapter Content
To calculate the correlation coefficient using grouped data, follow these steps: 1. Determine the midpoints of each class. 2. Compute the products of the midpoints. 3. Calculate the necessary sums (of midpoints and squared midpoints). 4. Apply the correlation formula for grouped data.
Detailed Explanation
First, for each class or interval that we've created, we find the midpoint. The midpoint is simply the average of the lower and upper boundaries of that class. Next, we multiply the midpoints from both variables together to create products, which we will use in our calculations. Then, we need to find the sums of these midpoints and their squares. All this data is then plugged into the correlation coefficient formula specific for grouped data, allowing us to find the relationship between the two variables effectively.
Examples & Analogies
Think of cooking where you need to combine different ingredients to get the right flavor. First, you measure each ingredient (which is your midpoint), then you mix them together (computing products). You need to write down the total quantities at each step (calculating sums) before you finally bake your dish (applying the formula). Each step is crucial to ending up with a delicious result, just like each step is essential in calculating correlation.
Benefits of Using Grouped Data
Chapter 3 of 3
🔒 Unlock Audio Chapter
Sign up and enroll to access the full audio experience
Chapter Content
Using grouped data formulas can simplify calculations, reduce the complexity of data analysis, and provide clearer insights into correlations.
Detailed Explanation
Grouped data allows us to manage large datasets more effectively, providing a high-level overview without losing essential details. When we simplify our data, we can focus on trends and patterns. This reduction in complexity often leads to clearer results in correlation analysis, highlighting how two variables relate to one another without the noise of individual data points.
Examples & Analogies
Imagine you are a teacher reviewing student test scores from a class of 30 students. If you look at each student's score individually, it might be overwhelming. However, if you create groups (A grades, B grades, C grades), it would be much easier to see how many students performed well overall. This grouped perspective gives you a clearer understanding than the detailed raw scores.
Key Concepts
-
Grouped Data: Data categorized into groups for analysis.
-
Correlation Coefficient: A measure of the degree of relationship between two variables.
-
Covariance: A measure reflecting how two variables change together.
-
Deviations: Differences between data points and the mean.
Examples & Applications
In a grouped age data set, the ages of participants are organized into categories such as 0-10, 11-20, etc., allowing for efficient calculation of the correlation coefficient based on frequency.
If a researcher has data on the annual income and education levels of 100 individuals grouped into income brackets, using grouped data formulas will allow them to find the correlation between income and education level.
Memory Aids
Interactive tools to help you remember key concepts
Rhymes
When data's too great to see, group it together, that's the key!
Stories
Imagine a librarian with hundreds of books; organizing them by genre lets her find and analyze them much faster, just like we do with grouped data in statistics.
Memory Tools
To find correlation, remember: Mean, Deviate, Multiply, and Sum - that’s how we determine outcomes!
Acronyms
GDC
Grouped Data Correlation - keep it simple to understand correlation in groups.
Flash Cards
Glossary
- Grouped Data
Data that is organized into groups or intervals for easier analysis.
- Correlation Coefficient
A numerical value determining the strength and direction of a relationship between two variables.
- Covariance
A measure of how much two random variables change together.
- Deviations
Differences between individual data points and the mean.
Reference links
Supplementary resources to enhance your learning experience.