
Assumptions of Break-even Analysis
Enroll to start learning
You’ve not yet enrolled in this course. Please enroll for free to listen to audio lessons, classroom podcasts and take practice test.
Interactive Audio Lesson
Listen to a student-teacher conversation explaining the topic in a relatable way.
Classification of Costs
🔒 Unlock Audio Lesson
Sign up and enroll to listen to this audio lesson

Let's start with our first assumption: all costs can be classified into fixed and variable. Why is it important to differentiate between these two?

Because it helps in determining how much expenses change with production levels!
Exactly! Fixed costs like rent stay the same no matter how much you produce, whereas variable costs, like raw materials, change. Can anyone give me an example of each?

Rent is a fixed cost, and the cost of ingredients for a bakery would be a variable cost!
Great examples! Remember, costs like these are foundational in calculating the break-even point.
Constant Selling Price
🔒 Unlock Audio Lesson
Sign up and enroll to listen to this audio lesson

Now, let's discuss why we assume the selling price per unit remains constant. What might happen if the price fluctuates?

If prices go up and down, it would make it hard to predict profits or losses!
That’s true! It complicates our calculations significantly. Can anyone think of a reason why selling prices might change?

Market competition or seasonal sales could affect pricing!
Exactly right! Just remember that for our analysis to work, we assume prices stay stable.
Linearity of Costs and Revenue
🔒 Unlock Audio Lesson
Sign up and enroll to listen to this audio lesson
Next assumption: costs and revenue being linear functions of output. What does linearity mean in this context?
It means that both costs and revenues increase at a constant rate with each unit produced or sold!
Right! This is depicted graphically as straight lines. But what’s the drawback of this assumption?
Real-world costs can change as you scale up production, right?
Correct! Always be cautious about this assumption; it simplifies our calculations but does not always reflect reality.
Production and Sales Levels Being Equal
🔒 Unlock Audio Lesson
Sign up and enroll to listen to this audio lesson
Now let’s move to our fourth assumption: production and sales levels are equal. Why is this an essential consideration?
It simplifies planning because there’s no leftover inventory!
Exactly! No leftover products make the calculations much cleaner. What issues might arise if production outstrips sales?
We could end up with unsold inventory, increasing costs!
Great point! Keeping this in mind ensures our analysis is more accurate.
Single Product Assumption
🔒 Unlock Audio Lesson
Sign up and enroll to listen to this audio lesson
Finally, let’s talk about the assumption of focusing on one product or constant sales mix. Why do we use this assumption?
It streamlines calculations. If there are multiple products, it complicates knowing how each affects costs and revenues!
That's right! It simplifies the analysis but isn't always realistic. What might be a challenge if a business does have a diverse product line?
They would have to consider different costs and price points for each product!
Exactly! So, understanding these assumptions helps us appreciate their implications on real-world applications of break-even analysis.
Introduction & Overview
Read summaries of the section's main ideas at different levels of detail.
Quick Overview
Standard
The assumptions of break-even analysis form the foundational guidelines that influence its application. This section outlines five primary assumptions that include the classification of costs into fixed and variable, the constancy of selling prices, linearity of costs and revenue, equality of production and sales levels, and the presence of a single product or constant sales mix.
Detailed
Assumptions of Break-even Analysis
Break-even analysis is a crucial tool for determining the minimum level of sales required to avoid losses. For it to be effective, a series of assumptions must be adhered to. These assumptions are crucial because they simplify the complexities of real-world financial scenarios and enable effective decision-making. Here’s a breakdown of the five key assumptions:
- All costs can be clearly classified into fixed and variable: This assumption asserts that every business expense can be categorized distinctly, which is essential for calculating the break-even point effectively. Fixed costs remain the same irrespective of the production level, while variable costs change with levels of production.
- Selling price per unit remains constant: This assumption implies that the price at which a product is sold does not fluctuate with the volume sold, simplifying the calculations. In reality, prices may change due to discounts or market conditions, which can affect analysis outcomes.
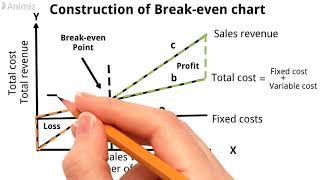
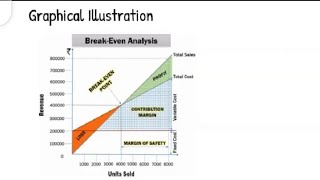
- Costs and revenue are linear functions of output: This means that costs and revenues increase proportionally with output. They are represented graphically as straight lines. This may not be true in real businesses where costs can escalate at different production levels due to economics of scale, etc.
- Production and sales levels are equal (no inventory): It is assumed that whatever is produced is sold immediately, and no unsold inventory remains, which is not common in many businesses.
- Only one product or constant sales mix exists in case of multiple products: The analysis assumes reliance on one product or a fixed set of products, which simplifies the calculations. In many businesses, multiple products with varying costs and contributions complicate the break-even analysis.
These assumptions, while simplifying the analysis, may not always hold true in every business context. Understanding these limitations is vital for making informed financial decisions.
Youtube Videos


Audio Book
Dive deep into the subject with an immersive audiobook experience.
Cost Classification
Chapter 1 of 5
🔒 Unlock Audio Chapter
Sign up and enroll to access the full audio experience
Chapter Content
- All costs can be clearly classified into fixed and variable.
Detailed Explanation
In break-even analysis, it's essential that all costs incurred by the company can be distinctly categorized as either fixed or variable. Fixed costs are those that do not change regardless of how much product is produced, such as rent or salaries. In contrast, variable costs change directly in proportion to the production volume, such as materials or direct labor costs. This clear classification simplifies the analysis and makes it easier to predict how costs will behave when production levels fluctuate.
Examples & Analogies
Think about running a coffee shop. The rent for your café is a fixed cost since it remains the same each month regardless of how many cups of coffee you sell. However, the cost of coffee beans is a variable cost because it increases as you sell more cups. Understanding these distinctions helps you project how changes in sales will impact overall profitability.
Constant Selling Price
Chapter 2 of 5
🔒 Unlock Audio Chapter
Sign up and enroll to access the full audio experience
Chapter Content
- Selling price per unit remains constant.
Detailed Explanation
The assumption that the selling price per unit remains constant is crucial for break-even analysis. This means that regardless of how many units of a product are sold, the price charged for each unit does not change. This assumption enables the calculation of revenue straightforwardly by multiplying the number of units sold by the price per unit, allowing easier determination of the break-even point.
Examples & Analogies
Consider a bakery selling cupcakes at a fixed price of ₹100 each. Whether you sell 10 or 100 cupcakes, the price remains the same. This constancy allows the bakery to project total revenue accurately, making financial planning and analysis more manageable.
Linear Cost and Revenue Functions
Chapter 3 of 5
🔒 Unlock Audio Chapter
Sign up and enroll to access the full audio experience
Chapter Content
- Costs and revenue are linear functions of output.
Detailed Explanation
In break-even analysis, the assumption that costs and revenues are linear functions of output implies that as production or sales increase, both costs and revenues increase at a constant rate. This linearity helps create a straight-line graph for cost and revenue, simplifying calculations and helping visualize the break-even point where these two lines intersect.
Examples & Analogies
Imagine a factory producing toys. If producing one toy costs ₹50 in materials and labor, then producing 100 toys costs ₹500. Similarly, if each toy sells for ₹100, selling 100 toys generates ₹10,000 in revenue. This consistent relationship makes it easy to plot and predict outcomes on a graph.
Equal Production and Sales Levels
Chapter 4 of 5
🔒 Unlock Audio Chapter
Sign up and enroll to access the full audio experience
Chapter Content
- Production and sales levels are equal (no inventory).
Detailed Explanation
The assumption that production and sales levels are equal means that all products produced are sold without creating inventory. This scenario posits that there are no leftover or unsold products at the end of a period. This assumption simplifies the break-even analysis since it focuses solely on the sales generated from the output produced, ensuring that all fixed and variable costs are matched by generated revenue.
Examples & Analogies
Visualize a lemonade stand where you make exactly 20 cups of lemonade and sell all 20 with none left over. This aligns production perfectly with sales, which means every cup sold contributes directly to covering costs, making analysis straightforward.
Single Product or Constant Sales Mix
Chapter 5 of 5
🔒 Unlock Audio Chapter
Sign up and enroll to access the full audio experience
Chapter Content
- Only one product or constant sales mix exists in case of multiple products.
Detailed Explanation
This assumption states that either a company focuses solely on one product, or if multiple products are sold, their sales mix remains constant. This uniformity allows for simpler calculations regarding break-even points and overall profitability. If a company changes its product mix frequently, the complexities could affect cost calculations and overall revenue projections, complicating break-even analysis.
Examples & Analogies
Imagine a small pizzeria that offers just one type of pizza. Knowing exactly how many pizzas they sell simplifies the budgeting process. Now, think of a food truck that sells tacos, nachos, and burritos. If the truck varies its sales mix every day, forecasting profits and understanding costs becomes trickier, making strategic decisions more complicated.
Key Concepts
-
Cost Classification: Understanding the difference between fixed and variable costs is essential for break-even analysis.
-
Constant Selling Price: The assumption of a constant selling price simplifies analysis but may not reflect real market conditions.
-
Linearity: The assumption that costs and revenue behave linearly with respect to output helps in calculations.
-
Production and Sales Equality: Assuming equal production and sales levels aids in realistic breaking down of financials.
-
Single Product Assumption: Simplifies calculations but may not apply to businesses with diverse product lines.
Examples & Applications
In a bakery, rent (fixed cost) would remain the same regardless of how many pies are made, while the cost of baking ingredients (variable cost) increases with each pie.
A software company may sell a program for a fixed price; changes in pricing can occur due to promotions or varying market demand.
Memory Aids
Interactive tools to help you remember key concepts
Rhymes
Costs split in two, fixed and variable too, break-even we seek, with prices that stick!
Stories
Imagine a bakery. The owner needs to decide how many cakes to bake each day. Fixed costs like rent are always there, but the more cakes they sell, the more they earn. If they keep prices steady, they can easily calculate at what point they just break even.
Memory Tools
FIVE - Fixed and Variable costs; Independent selling price; Variability of costs and revenue; Equal production and sales; Only one product or constant mix.
Acronyms
SIMPLE - Stable price, Identifiable costs, Multiple products only in constant mix, Production equals sales, Linear relationships.
Flash Cards
Glossary
- Breakeven Point (BEP)
The level of output or sales at which total revenue equals total cost.
- Fixed Costs
Costs that remain constant regardless of production levels.
- Variable Costs
Costs that vary with the level of production.
- Contribution Margin
The difference between the selling price per unit and the variable cost per unit.
Reference links
Supplementary resources to enhance your learning experience.