
Break-even Analysis and Marginal Costing
Enroll to start learning
You’ve not yet enrolled in this course. Please enroll for free to listen to audio lessons, classroom podcasts and take practice test.
Interactive Audio Lesson
Listen to a student-teacher conversation explaining the topic in a relatable way.
Introduction to Break-even Analysis
🔒 Unlock Audio Lesson
Sign up and enroll to listen to this audio lesson

Today, we will explore the concept of Break-even Analysis. Can anyone tell me what the Break-even Point is?

Isn't it the point where we neither make a profit nor a loss?
Exactly! The Break-even Point (BEP) is where total revenues match total costs. This is critical for businesses to understand their minimum sales volume to avoid losses. Remember the acronym **BEP**: Break-even Point.

What are fixed and variable costs?
Great question! Fixed costs stay constant regardless of production, like rent, while variable costs change with production levels, like materials. Think of it like a room's rent versus how much you spend on party supplies based on the number of guests.

So how does this help a business?
It's crucial for decision-making in areas like pricing and assessing impacts of cost changes. Remember: **Break-even Analysis helps manage risk!**

Can we visualize this somehow?
Yes! A break-even chart shows the relationship between costs, volume, and profits through graphical means. We'll dive deeper into that in our next session.
Assumptions and Formulas of Break-even Analysis
🔒 Unlock Audio Lesson
Sign up and enroll to listen to this audio lesson

Now, let's discuss the assumptions of Break-even Analysis. Who can tell me about some of these assumptions?
Maybe that fixed and variable costs can easily be classified?
Correct! All costs need to be classified. Additionally, selling price remains constant, revenue, and costs are linear. Can anyone tell me what this means in a practical sense?
It means we can't have changing prices or complicated cost structures?
Exactly! Now, let’s look at the formulas. The BEP in units can be calculated by dividing fixed costs by the contribution margin. Can anyone tell me what contribution margin is?
Isn't it selling price minus variable cost?
Yes! The contributions tell us how much each unit sold contributes to covering fixed costs. Keep in mind this formula: **BEP (units) = Fixed Costs / Contribution Margin!** You all are doing wonderfully.
Graphical Understanding and Margin of Safety
🔒 Unlock Audio Lesson
Sign up and enroll to listen to this audio lesson
Let's visualize the concepts discussed with graphs. The break-even chart shows fixed costs, total costs, and total revenue lines. Where should these lines intersect?
At the Break-even Point?
Exactly! And this intersection indicates where we break even. Now, what is the Margin of Safety?
Is it how much sales can drop before we hit break-even?
Right again! It measures a buffer for safety in sales. The formula is: **MoS = Actual Sales - BEP Sales.** This tells us how much cushion we have in sales, which is crucial for strategic planning.
How can we apply this to tech projects?
Good question! For instance, SaaS products could use this analysis to determine minimum subscriptions needed. Always remember: **Operational security requires understanding our margins!**
Introduction to Marginal Costing
🔒 Unlock Audio Lesson
Sign up and enroll to listen to this audio lesson
Switching gears, let’s dive into Marginal Costing. Can anyone describe what marginal costing refers to?
I think it deals with variable costs assigned to products?
Yes! In Marginal Costing, only variable costs are considered for product pricing, while fixed costs are treated as period costs. Remember: **Marginal costs help in short-term decision making!**
How does that differ from regular costing?
Great question! Regular costing includes both fixed and variable costs in product termination. In Marginal Costing, fixed costs are viewed separately, which can lead to clearer insights on product profitability and pricing decisions.
How do we calculate profit then?
Profit is calculated as Total Contribution minus Fixed Costs. Always keep in mind: contribution helps cover fixed costs and adds to profits!
Applications and Comparisons
🔒 Unlock Audio Lesson
Sign up and enroll to listen to this audio lesson
Finally, let’s discuss the applications of Break-even Analysis in IT projects. How about determining pricing for a mobile app? Could that use Break-even Analysis?
Absolutely! It helps assess how many downloads we need to cover development costs.
Exactly! This can also assist in product decisions, like evaluating profitability of a new software tool. Lastly, how does Marginal Costing compare with Absorption Costing?
Marginal Costing uses only variable costs, while Absorption includes both, right?
Correct! Marginal Costing focuses on decisions, while Absorption is more for financial reporting. Remember: **Different contexts require different costing methods!**
Introduction & Overview
Read summaries of the section's main ideas at different levels of detail.
Quick Overview
Standard
Break-even Analysis determines the sales volume needed to avoid losses, while Marginal Costing focuses on variable costs for product costing. These concepts are crucial for pricing strategies, production planning, and resource allocation in business operations, especially for tech startups.
Detailed
Break-even Analysis and Marginal Costing
In this section, we delve into two pivotal concepts within managerial finance: Break-even Analysis and Marginal Costing. These tools help managers understand their financial circumstances better, ultimately leading to informed decision-making.
Key Definitions
- Break-even Point (BEP): The level of output or sales at which total revenue equals total costs.
- Fixed Costs: Costs that remain constant despite the level of production, like rent or salaries.
- Variable Costs: Costs that fluctuate according to production levels, such as materials costs.
- Contribution Margin: It is computed as the selling price per unit minus the variable cost per unit.
Objectives of Break-even Analysis
Break-even Analysis is employed to ascertain the minimum sales volume necessary to prevent losses while additionally guiding pricing strategies, assessing cost impacts, and aiding decisions on product mix and expansion.
Assumptions and Formulas
Several assumptions underline the utility of break-even analysis, including the constancy of selling price and linearity in costs and revenues. We provided corresponding formulas for determining the BEP in both units and sales value.
Graphical Representation
The section also incorporates graphical representation through break-even charts, illustrating relationships among costs, volume, and profits.
Margin of Safety (MoS)
The concept of Margin of Safety is introduced as a helpful metric in assessing the risk level of business operations against potential sales declines, adding a layer of security to financial planning.
Applications of Break-even Analysis
Specific applications tailored to IT projects are discussed, illustrating practical implementations that can help tech startups make informed financial decisions.
Marginal Costing
Marginal costing is another vital tool where only variable costs are assigned to products, while fixed costs are considered period costs. This part emphasizes significant components like marginal cost, contribution, and profit.
Conclusion
Understanding these tools is essential for financial planning, resource allocation, and overall business sustainability, particularly in the fast-paced tech industry.
Youtube Videos

![Break Even Chart in CVP Analysis ~ Marginal Costing [Cost Accounting] ~ For B.Com/M.Com/CA/CS/CMA](https://img.youtube.com/vi/EMVs0IL0EfU/mqdefault.jpg)


Audio Book
Dive deep into the subject with an immersive audiobook experience.
Introduction to Break-even Analysis and Marginal Costing
Chapter 1 of 16
🔒 Unlock Audio Chapter
Sign up and enroll to access the full audio experience
Chapter Content
In the competitive world of business, financial planning and decision-making are crucial to a company's success. Two essential tools used for these purposes are Break-even Analysis and Marginal Costing. These tools help managers determine the level of output or sales at which the business neither makes a profit nor a loss (break-even), and also understand how costs behave with changes in production. For BTech CSE students venturing into tech startups, software product development, or IT management, understanding these concepts is vital for project budgeting, resource allocation, and cost control.
Detailed Explanation
This introduction emphasizes the importance of financial planning in business. Break-even analysis and marginal costing are two methods that help businesses identify how many units they need to sell to cover their costs. Essentially, they guide managers in making informed decisions about production and sales, ensuring that the company can sustain itself financially. For students, especially those entering tech fields, grasping these concepts allows them to efficiently manage project budgets and allocate resources effectively.
Examples & Analogies
Imagine starting a coffee shop. Before you open, it's crucial to know how many cups of coffee you need to sell just to cover your rent, utilities, and employee salaries. Understanding break-even analysis helps you make this estimate, guiding your decisions on pricing and how much coffee to brew each day. This foundational knowledge is what you gain from learning about break-even analysis and marginal costing.
Meaning of Break-even Analysis
Chapter 2 of 16
🔒 Unlock Audio Chapter
Sign up and enroll to access the full audio experience
Chapter Content
Break-even analysis is a technique used to determine the point at which total revenues equal total costs. At this point, the company breaks even, meaning it does not earn a profit or incur a loss.
Key Definitions:
- Break-even Point (BEP): The level of output or sales at which total revenue equals total cost.
- Fixed Costs: Costs that remain constant regardless of production levels (e.g., rent, salaries).
- Variable Costs: Costs that vary with the level of production (e.g., raw materials).
- Contribution Margin: Selling price per unit minus variable cost per unit.
Detailed Explanation
Break-even analysis focuses on identifying the break-even point (BEP), where the total revenue generated from sales equals the total costs incurred. At BEP, the business does not make a profit, but it also does not incur a loss. To understand this better, several key terms are defined: Fixed Costs are expenses that remain unchanged no matter how much you produce, like rent. Variable Costs fluctuate based on your production volume, such as the cost of ingredients in a restaurant. Lastly, the Contribution Margin is the profit made on each product sold after covering variable costs.
Examples & Analogies
Think of a lemonade stand. If you spend $20 on a table and lemonade mix (fixed cost), and each cup of lemonade costs you $1 to make (variable cost), then if you sell each cup for $3, your contribution margin for each cup is $2. To break even, you need to sell enough lemonade to cover that $20 fixed cost, which means selling 10 cups. Understanding these elements helps you plan your pricing and production effectively.
Objectives of Break-even Analysis
Chapter 3 of 16
🔒 Unlock Audio Chapter
Sign up and enroll to access the full audio experience
Chapter Content
- To determine the minimum sales volume to avoid losses.
- To help in pricing decisions.
- To assess the impact of changes in cost and volume.
- To assist in decision-making related to product mix and expansion.
Detailed Explanation
The objectives of break-even analysis are fundamental for any business strategy. First, it helps businesses identify how many units they must sell at a minimum to cover all costs and avoid losses. Second, it provides insights that aid in setting appropriate pricing strategies, ensuring prices are competitive while still covering costs. Third, by evaluating the potential impact of changing costs or sales volumes, businesses can forecast and react to market changes effectively. Lastly, it supports decision-making when considering introducing new products or expanding existing ones, ensuring that new initiatives are financially viable.
Examples & Analogies
When launching a new smartphone app, knowing the minimum number of downloads needed to cover development costs helps you set your marketing strategy. If the analysis shows you need 1,000 downloads to break even on a $5 app, you can adjust your pricing, promotional efforts, or app features to ensure you meet or exceed that target level.
Assumptions of Break-even Analysis
Chapter 4 of 16
🔒 Unlock Audio Chapter
Sign up and enroll to access the full audio experience
Chapter Content
- All costs can be clearly classified into fixed and variable.
- Selling price per unit remains constant.
- Costs and revenue are linear functions of output.
- Production and sales levels are equal (no inventory).
- Only one product or constant sales mix exists in case of multiple products.
Detailed Explanation
Assumptions underpinning break-even analysis help in simplifying the complex nature of business costs and revenues. The first assumption states that all costs can be easily categorized as either fixed or variable, facilitating clearer calculations. The second assumption implies that the selling price for each unit remains unchanged, which may not hold true in dynamic markets. The third assumption presumes that costs and revenue increase at a steady rate with output changes. The fourth assumes that all produced goods are sold without retaining inventory. Finally, if multiple products exist, it simplifies to assume these sales remain consistent, which is crucial for accurate analysis.
Examples & Analogies
If you're planning a homemade cookie business, you might assume that your cookie price stays the same, regardless of whether you sell 10 or 100 cookies, and that it costs the same to make each batch. However, if you run a promotional special with lower prices for bulk purchases, or if demand spikes unexpectedly, these assumptions need to be adjusted. Recognizing these assumptions helps in understanding the ideal conditions under which the break-even analysis is most accurate.
Break-even Point Formulas
Chapter 5 of 16
🔒 Unlock Audio Chapter
Sign up and enroll to access the full audio experience
Chapter Content
(a) In Units:
BEP (units) = Fixed Costs / Contribution per Unit
(b) In Sales Value:
BEP (₹) = Fixed Costs / Contribution Margin Ratio (CMR)
Where:
CMR = Contribution per Unit / Selling Price per Unit
Detailed Explanation
There are two primary formulas to calculate the break-even point (BEP): in units and in sales value. The first formula focuses on how many units need to be sold to cover fixed costs, using the contribution per unit to determine how much profit each unit contributes after covering variable costs. The second formula computes how much sales revenue is necessary to break even, using the Contribution Margin Ratio, which reflects the proportion of revenue left over after variable costs.
Examples & Analogies
In our cookie business scenario, if the fixed costs are $200, the contribution margin per batch of cookies sold is $10, the break-even point in units would be 200 / 10 = 20 batches. Alternatively, if you calculate the total sales value, assuming the selling price is $50 per batch, you can derive the break-even sales target and understand quickly what revenue figure you should target first.
Graphical Representation: Break-even Chart
Chapter 6 of 16
🔒 Unlock Audio Chapter
Sign up and enroll to access the full audio experience
Chapter Content
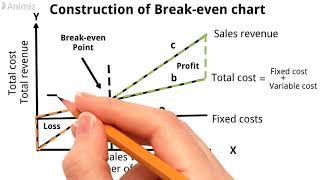
The break-even chart is a graphical tool that shows the relationship between cost, volume, and profits. It has:
- X-axis: Units sold/produced
- Y-axis: Revenue and cost
- Lines plotted: Fixed cost line (horizontal), total cost line (starts from fixed cost), and total revenue line (starts from zero)
The intersection of the total cost line and total revenue line is the Break-even Point.
Detailed Explanation
The break-even chart visually represents the interplay between costs, revenue, and volume. On the vertical axis (Y-axis), we have revenue and cost values, while the lower horizontal axis (X-axis) depicts the number of units produced or sold. The fixed cost line remains constant across the chart, reflecting steady costs irrespective of production levels. The total cost line starts at the fixed cost and increases with output, while the total revenue line starts at zero and increases with sales volume. The meeting point of the total cost line and total revenue line indicates the break-even point where profit equals zero.
Examples & Analogies
Picture a graph that illustrates your week of selling lemonade. As you sell more cups (gaining revenue), your costs also rise (more lemons, sugar, and cups), creating two lines that intersect. The point at which your revenue balances with the costs indicates the moment you can start making a profit, clearly visualized on this graph. Such visual representation makes the relationship of these factors intuitive, allowing quick assessment of the business's financial health.
Margin of Safety (MoS)
Chapter 7 of 16
🔒 Unlock Audio Chapter
Sign up and enroll to access the full audio experience
Chapter Content
Margin of safety shows how much sales can drop before the business reaches its break-even point.
MoS = Actual Sales - Break-even Sales
MoS % = (MoS / Actual Sales) × 100
A higher MoS indicates greater security.
Detailed Explanation
The Margin of Safety (MoS) quantifies how resilient a business is to a decrease in sales. It measures the difference between actual sales and the sales level at which the company breaks even. If sales decline, the MoS indicates how much buffer is left before the company starts incurring losses. Expressing this as a percentage allows for a broader understanding of financial stability; a higher percentage indicates a stronger position to withstand fluctuations.
Examples & Analogies
Consider the cookie business again. If you regularly sell 100 cookies a week (actual sales) but know you need to sell only 50 to not lose money (break-even sales), your MoS is 50 cookies. So, if sales drop to 75 cookies, you're still secure, as you have a 25 cookies buffer before hitting the break-even point. This concept helps you gauge how risky or stable your sales situation is.
Applications of Break-even Analysis in IT Projects
Chapter 8 of 16
🔒 Unlock Audio Chapter
Sign up and enroll to access the full audio experience
Chapter Content
- Determining minimum subscriptions for SaaS products to cover development cost.
- Deciding pricing for mobile apps or digital services.
- Evaluating profitability of a new software tool or product.
- Budgeting for cloud services and computing infrastructure.
Detailed Explanation
In the realm of IT projects, break-even analysis is invaluable. For Software as a Service (SaaS) products, it helps determine how many subscriptions are needed to cover initial development costs before making a profit. Similarly, it aids development teams in pricing their mobile applications, ensuring costs are covered while remaining competitive. Additionally, evaluating the profitability of new software tools relies on understanding what sales volume or pricing helps the product succeed financially. Lastly, budgeting for cloud services with such analysis ensures that technology investments align with potential revenue streams.
Examples & Analogies
Imagine you are developing a new fitness app. Using break-even analysis, you calculate that you need at least 1,000 annual subscriptions priced at $50 each to break even (cover costs). This information is essential; it informs your marketing strategy, the expected demand you need to generate, and helps you price services based on what users are willing to pay while ensuring you design features that will attract those users.
Marginal Costing: Meaning
Chapter 9 of 16
🔒 Unlock Audio Chapter
Sign up and enroll to access the full audio experience
Chapter Content
Marginal costing is a costing technique where only variable costs are charged to the product, and fixed costs are treated as period costs and written off against revenue.
Detailed Explanation
Marginal costing involves assigning only the variable costs associated with product production to each unit, while fixed costs are not included in product valuation. Instead, these fixed costs are considered as periodic expenses that must be addressed against the revenue generated over the reporting period. This approach simplifies the overall cost structure, especially in short-term decision-making by focusing solely on costs that change with production levels.
Examples & Analogies
Returning to the cookie business—if each cookie batch costs $8 to make (variable costs), but the $200 for equipment is a fixed expense, in marginal costing, you'd only consider the $8 when pricing and decision-making. This allows you to focus on how each batch sold contributes to covering those fixed costs in the long run.
Key Concepts in Marginal Costing
Chapter 10 of 16
🔒 Unlock Audio Chapter
Sign up and enroll to access the full audio experience
Chapter Content
a. Marginal Cost:
The additional cost incurred to produce one more unit of a product.
Marginal Cost = Change in Total Cost / Change in Output
b. Contribution:
Contribution = Selling Price - Variable Cost
This is the amount available to cover fixed costs and contribute to profit.
c. Profit:
Profit = Total Contribution - Fixed Costs
Detailed Explanation
Several key concepts define marginal costing. First, Marginal Cost represents the additional cost to create one more unit of a product, calculated by the change in total costs divided by the change in output. Second, the Contribution identifies how much profit each sold unit provides after variable costs are deducted from the selling price—this amount helps businesses cover fixed costs and contribute to overall profit. Finally, Profit itself is calculated as the total contribution from all sales minus any fixed costs.
Examples & Analogies
If you create one more batch of cookies and it costs you an additional $8 (marginal cost), the contribution would show how much profit you gain from selling that batch by considering the selling price minus its costs. If you sell that batch at $50, your contribution will be $50 - $8 = $42. As you track these contributions over time, it signals how well you're covering fixed costs and what profits are being generated.
Features of Marginal Costing
Chapter 11 of 16
🔒 Unlock Audio Chapter
Sign up and enroll to access the full audio experience
Chapter Content
- Cost classification into fixed and variable is essential.
- Inventory is valued at variable cost only.
- Profit is a function of sales volume.
- Useful for short-term decision making.
Detailed Explanation
Marginal costing focuses on distinguishing between fixed and variable costs, which greatly aids in cost management and pricing strategies. In this method, inventory is valued solely at the variable production cost, meaning fixed costs are excluded from stock valuation. Importantly, profit is responsive to sales volume; as sales increase, profits typically follow if variable costs remain stable. This makes marginal costing particularly useful for making short-term decisions, allowing businesses to respond swiftly to changes in market demand without losing sight of fixed cost implications.
Examples & Analogies
In your cookie business, knowing that the cost of ingredients per batch (variable cost) helps you price effectively. If you decide to hold some cookies for sale tomorrow, you'd only consider the variable costs when valuing that inventory, simplifying your decisions. If you sell more batches in a busy week, it'll boost your profits accordingly, showcasing how marginal costs align decision-making with business demands.
Advantages of Marginal Costing
Chapter 12 of 16
🔒 Unlock Audio Chapter
Sign up and enroll to access the full audio experience
Chapter Content
- Simple and easy to understand.
- Aids in short-term decision making.
- Helps in identifying profitable and unprofitable products.
- Useful in determining selling prices during tough competition.
Detailed Explanation
Marginal costing provides various advantages for businesses, particularly in its straightforward nature, which makes it easy for managers and decision-makers to grasp. Its focus on variable cost facilitates informed short-term decisions like pricing, product line offerings, and profit maximization. By analyzing marginal contributions of each product, organizations can identify which products are successful and which aren’t, allowing for adjustments in production or marketing strategies. Furthermore, during competitive market conditions, it aids in setting prices that will still allow for profitability, even if discounts or lower prices are necessary.
Examples & Analogies
If competition in the cookie market heats up and lower pricing is needed, marginal costing allows you to explore how low you can go while still covering your costs. For example, if sale analysis shows that chocolate chip cookies are more profitable than others based on their contribution, you can focus more on them while considering possible pricing strategies to ensure sustained profits.
Limitations of Marginal Costing
Chapter 13 of 16
🔒 Unlock Audio Chapter
Sign up and enroll to access the full audio experience
Chapter Content
- Ignores fixed costs in product valuation.
- Not suitable for long-term planning.
- May not comply with GAAP or traditional accounting standards.
- Assumes linearity in cost behavior.
Detailed Explanation
Despite its benefits, marginal costing does have limitations. The exclusion of fixed costs from product valuation can mislead in scenarios where fixed costs play a significant role. It's not the best approach for long-term planning because it takes a shorter, tactical view and neglects longer-term financial commitments. Additionally, it may not align with Generally Accepted Accounting Principles (GAAP) which require full absorption costing for financial reporting. Lastly, the assumption that costs behave linearly may not hold true in all production environments, leading to inaccuracies in forecasting and decision-making.
Examples & Analogies
Going back to our cookie business, if you plan to have a bakery that requires considerable investment in equipment and staff—the fixed costs matter. If you only rely on marginal costing for pricing strategy, you might overlook the need to incorporate these costs into long-term pricing decisions, potentially leading to losses as your business grows. Realizing these limitations helps ensure that decisions encompass all business factors.
Decision-Making Using Marginal Costing
Chapter 14 of 16
🔒 Unlock Audio Chapter
Sign up and enroll to access the full audio experience
Chapter Content
Marginal costing helps in answering managerial questions such as:
- Make or Buy Decisions: Whether to manufacture a component in-house or outsource.
- Product Mix Decisions: Choosing the most profitable combination of products.
- Accepting Special Orders: If offered below normal price but above variable cost.
- Shut Down or Continue: During losses, assess if continuing makes sense.
Detailed Explanation
Using marginal costing as a decision-making tool allows managers to effectively evaluate options. For instance, 'Make or Buy Decisions' leverage the marginal cost of production compared to the prices offered by suppliers. Similarly, when assessing a 'Product Mix,' the contribution margins guide which products should be prioritized. If a special order comes in below the normal price but above the marginal cost, accepting it might still make sense for short-term gains. The framework also helps in crisis situations by evaluating whether closing operations temporarily is preferable to continuing losses.
Examples & Analogies
Imagine during a slow season for your cookies, you are deciding whether to keep your stand open or close it down. Marginal costing can help you discern if you can make enough sales to at least cover your variable costs. If you find that even with a few sales you can offset some costs, you might decide it’s worthwhile to remain open rather than incurring fixed costs from being shut down.
Comparison: Marginal Costing vs Absorption Costing
Chapter 15 of 16
🔒 Unlock Audio Chapter
Sign up and enroll to access the full audio experience
Chapter Content
| Aspect | Marginal Costing | Absorption Costing |
|---|---|---|
| Cost charged to product | Only variable cost | Variable + fixed cost |
| Fixed cost treatment | Period cost | Product cost |
| Inventory valuation | At variable cost | At total cost |
| Use | Decision making | Financial reporting |
| Profit calculation | Based on contribution | Based on net profit |
Detailed Explanation
Comparison between marginal costing and absorption costing reveals critical differences in how costs are treated and applied in financial decision-making. Marginal costing charges only variable costs to products, simplifying decisions for short-term strategies primarily focused on liquidity and flow. In contrast, absorption costing accounts for both variable and fixed costs, providing a broader view of financial health but complicating immediate decision-making. Additionally, while marginal costing is more useful for internal decisions, absorption costing aligns more closely with formal financial reporting requirements. Definitions of profit also vary, with marginal often focusing on contributions and absorption considering all incurred costs.
Examples & Analogies
Again with your cookie shop, using marginal costing lets you quickly see how much profit each cookie batch creates based only on ingredient costs, which aids urgent decisions. In contrast, absorption costing would account for equipment depreciation as well, giving a fuller picture but potentially complicating quick business decisions. Knowing each method's strengths can help you adapt strategies based on immediate needs versus comprehensive accountability.
Numerical Example
Chapter 16 of 16
🔒 Unlock Audio Chapter
Sign up and enroll to access the full audio experience
Chapter Content
Given:
- Fixed cost = ₹50,000
- Variable cost per unit = ₹150
- Selling price per unit = ₹250
Calculate:
- BEP in units
- BEP in ₹
- Contribution per unit
- Profit at 800 units sold
Solution:
- Contribution per unit = 250 - 150 = ₹100
- BEP (units) = 50,000 / 100 = 500 units
- BEP (₹) = 500 × 250 = ₹1,25,000
- Profit at 800 units = (800 × 100) - 50,000 = ₹30,000
Detailed Explanation
This numerical example illustrates the calculation process for breaking even and determining profit. First, the contribution per unit is calculated by subtracting variable costs from the selling price, resulting in a net contribution of ₹100 per cookie batch. Next, to find the break-even point in units, you divide the fixed costs (₹50,000) by the net contribution (₹100), resulting in 500 batches needing to be sold to break even. When calculating break-even in revenue, you multiply the break-even units by the price per unit to determine that ₹1,25,000 needs to be earned for break-even. Finally, calculating profit at 800 units sold provides insights into overall performance by applying the total contributions against fixed costs to highlight net gain.
Examples & Analogies
Using the earlier cookie shop analogy, if you estimate production costs and selling prices correctly, you can figure out the exact number of batches to sell to stay above water financially. Knowing that you need to sell 500 batches brings clarity to your sales targets and helps craft promotional strategies to reach that goal effectively.
Key Concepts
-
Break-even Analysis: A technique to determine the point where revenues equal costs.
-
Fixed Costs: Costs that do not change with production levels.
-
Variable Costs: Costs that increase or decrease with production volume.
-
Contribution Margin: The amount from sales that contributes to fixed costs after variable costs are deducted.
-
Margin of Safety: The excess of sales over the break-even point.
-
Marginal Costing: Costing that considers only variable costs for product costing.
Examples & Applications
If a company has fixed costs of ₹50,000, variable costs of ₹150 per unit, and sells the product for ₹250, the BEP in units can be calculated as ₹50,000 / ₹100 (which is the contribution margin) = 500 units.
For a SaaS application requiring minimum subscriptions, using Break-even Analysis could help determine how many users are needed to cover upfront development costs.
Memory Aids
Interactive tools to help you remember key concepts
Rhymes
To break even, just remember, sales and costs should be a member, of a duo that doesn't break apart, or else the business won't be smart!
Stories
Imagine a small coffee shop that tracks every sale and cost diligently. They discover that they need to sell 100 cups a day to break even, leading to strategic pricing and cost control decisions, helping them grow their customer base while managing risks.
Memory Tools
Remember BFC and MoS: Break-even Point, Fixed Costs, Marginal Costing, and Margin of Safety — they all contribute to smart financial decisions!
Acronyms
Use **MAPE** to remember Marginal Costing
Marginal costs
Assessment
Pricing
Evaluation.
Flash Cards
Glossary
- Breakeven Point (BEP)
The level of output or sales at which total revenue equals total cost.
- Fixed Costs
Costs that remain constant regardless of production levels.
- Variable Costs
Costs that vary with the level of production.
- Contribution Margin
Selling price per unit minus variable cost per unit.
- Margin of Safety (MoS)
Indicates how much sales can drop before reaching the break-even point.
- Marginal Costing
Costing technique that only charges variable costs to products, treating fixed costs as period costs.
Reference links
Supplementary resources to enhance your learning experience.