
Pushover Analysis and Capacity Spectrum Method
Enroll to start learning
You’ve not yet enrolled in this course. Please enroll for free to listen to audio lessons, classroom podcasts and take practice test.
Interactive Audio Lesson
Listen to a student-teacher conversation explaining the topic in a relatable way.
Introduction to Pushover Analysis
🔒 Unlock Audio Lesson
Sign up and enroll to listen to this audio lesson

Today, we will discuss pushover analysis, which is a static nonlinear analysis technique used in earthquake engineering. Can anyone tell me what they understand by the term 'pushover' in this context?

Is it about pushing a structure until it collapses?
Exactly! We apply lateral loads incrementally to evaluate how a structure behaves under seismic forces. This helps us analyze its strength and stiffness degradation.

What is the main goal of this analysis?
Good question! The goal is to determine the capacity of the structure by finding the point at which it can no longer withstand additional loads. Let's remember the mantra: 'Push it until you see its strength!'

What kind of structures is this method used for?
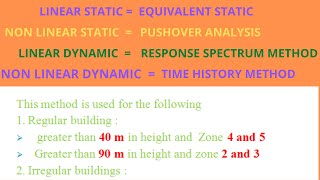
Primarily low- to mid-rise buildings. However, there are certain limitations.

What limitations are you talking about?
Great question! There are assumptions involved like invariant mode shapes, which might not be valid for irregular structures. So, it's essential to use this method judiciously. In summary, pushover analysis allows us to understand the earthquake resilience of structures by pushing them beyond their limits!
Understanding Capacity Curve
🔒 Unlock Audio Lesson
Sign up and enroll to listen to this audio lesson

Moving on, let’s discuss the capacity curve. Who can explain what a capacity curve represents?
Is it the relationship between the base shear and the top displacement of the structure?
Exactly! The capacity curve allows us to visualize how much lateral force the structure can withstand as it displaces. Can anyone think of why this curve is crucial?
It helps assess how well a building can perform under seismic conditions?
Right on target! The shape and slope of the curve indicate how the structure degrades under stress and can inform design choices. Remember: 'Curve your way to safety!'
What happens when the capacity decreases?
Excellent point! As the structure undergoes more cycles of loading and unloading, it can lose strength. Understanding this helps engineers optimize designs for safety.
Performance Point in Capacity Spectrum Method
🔒 Unlock Audio Lesson
Sign up and enroll to listen to this audio lesson
Next, let’s look into the concept of the performance point. What do you think this term means?
Is it where the demand curve intersects with the capacity curve?
Absolutely! This intersection, known as the performance point, helps us understand whether the structure can meet the desired performance objectives during seismic events.
Why is this important in design?
Great question! Designers use the performance point to ensure that structures can handle specific levels of earthquake events without significant damage. Remember, 'Find your point of performance for safer structures!'
Does this apply only for new buildings?
Not necessarily! While it is important for new designs, it can also help assess existing structures to determine if they need retrofitting.
Limitations of Pushover Analysis
🔒 Unlock Audio Lesson
Sign up and enroll to listen to this audio lesson
Finally, let’s discuss the limitations of pushover analysis. Why do you think we should be aware of these limitations?
So that we don't misuse the method, right?
Exactly! One limitation is its validity for predominantly low- to mid-rise buildings. If we're analyzing very tall buildings, results can be misleading due to dynamic effects.
And what about the assumption of invariant mode shapes?
Yes, that's critical! This assumption may not hold for irregular structures, leading to inaccuracies. Remember this: 'Limitations shape our understanding!'
So, knowing these limits makes us better engineers?
Exactly! Understanding limitations empowers us to use pushover analysis effectively and safely.
Introduction & Overview
Read summaries of the section's main ideas at different levels of detail.
Quick Overview
Standard
The pushover analysis technique involves applying lateral loads incrementally to a structure until it reaches a target displacement or collapses, allowing for the calculation of the capacity curve. This curve, which represents the relationship between base shear and top displacement, is compared with demand curves to find the performance point, essential for performance-based design. Limitations include its applicability primarily for low- to mid-rise structures and the assumption of invariant mode shapes.
Detailed
Pushover Analysis and Capacity Spectrum Method
Concept of Pushover Analysis
Pushover analysis is a static nonlinear analysis technique extensively used in earthquake engineering to evaluate the performance of structures. The method works by applying lateral loads to the structure incrementally until either a specific target displacement is achieved, or the structure collapses. This approach helps identify the sequence of strength and stiffness degradation within the structure, leading to more robust earthquake-resistant design.
Capacity Curve
The capacity curve is generated from the results of the pushover analysis, illustrating the relationship between the base shear and the top displacement of the structure. As the structure undergoes the pushover analysis, its stiffness may degrade; therefore, the shape and slope of the capacity curve provide valuable insights into the structural behavior under lateral loading.
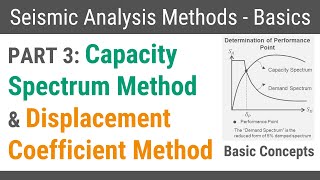
Performance Point and Capacity Spectrum
In performance-based design, identifying the performance point is crucial. This point is determined by the intersection of the demand curve (representing the seismic demand on the structure) and the capacity curve. Understanding this intersection aids engineers in assessing whether the structure can sustain the prescribed performance level during seismic events.
Limitations and Assumptions
While the pushover analysis method is powerful, it has limitations. It is primarily valid for low- to mid-rise buildings and assumes that the mode shapes remain invariant, which may not hold true in highly irregular structures. Understanding these limitations is essential for structural engineers to make informed decisions when applying the pushover analysis in their designs.
Youtube Videos


Audio Book
Dive deep into the subject with an immersive audiobook experience.
Concept of Pushover Analysis
Chapter 1 of 4
🔒 Unlock Audio Chapter
Sign up and enroll to access the full audio experience
Chapter Content
Static nonlinear analysis technique. Applies lateral loads incrementally until target displacement or collapse.
Detailed Explanation
Pushover analysis is a method used to evaluate the structural performance of buildings, particularly under seismic loads. This technique applies horizontal forces to a structure in a step-wise manner. These forces are increased until the structure reaches a defined target displacement or begins to fail. This approach allows engineers to observe how the building behaves under varying loads, identifying points of weakness and potential failure modes.
Examples & Analogies
Imagine a child pushing a swing. Initially, the swing moves back and forth easily. However, as the child pushes harder and more frequently, the swing begins to move in more extreme arcs. Eventually, if pushed too hard, the swing may break or fail to function as intended. Similarly, in pushover analysis, engineers gradually apply increasing loads to see how the building can handle stress until it can no longer maintain its structural integrity.
Capacity Curve
Chapter 2 of 4
🔒 Unlock Audio Chapter
Sign up and enroll to access the full audio experience
Chapter Content
Base shear vs top displacement. Reflects structural stiffness degradation.
Detailed Explanation
The capacity curve is a graphical representation that shows the relationship between the base shear (the total horizontal force acting at the foundation) and the top displacement (the amount the building moves or sways at the top). As the structure is pushed and subjected to increasing loads, this curve illustrates how the building's stiffness may degrade due to yielding of materials or other factors. Understanding this curve is crucial for assessing how much load the structure can withstand before failure.
Examples & Analogies
Consider a rubber band. When you slightly stretch it, it easily returns to its original shape. As you stretch it more and more, it can start to lose its elasticity and won’t return to the same length. If you stretch it too far, it will snap. The capacity curve is like observing how much force you can apply to the rubber band before it either deforms or breaks.
Performance Point and Capacity Spectrum
Chapter 3 of 4
🔒 Unlock Audio Chapter
Sign up and enroll to access the full audio experience
Chapter Content
Intersection of demand and capacity curves. Used in performance-based design.
Detailed Explanation
In the context of pushover analysis, the performance point is a critical intersection on the graph where the capacity curve meets the demand curve. The demand curve represents the expected loads during an earthquake, while the capacity curve shows how much load the structure can withstand. The performance point signifies the maximum load the structure can handle before significant damage occurs. This point is essential in performance-based design, as it helps engineers ensure that buildings can withstand specific levels of seismic activity.
Examples & Analogies
Think of a shelf that holds a collection of books. The strength of the shelf (capacity) can be represented by how heavy the books are. If you keep adding books (demand), there will be a point where the shelf will bend or break. The performance point is the moment when the weight of the books matches the shelf's limit. Engineers want to ensure that the weight of the books (earthquake forces) does not exceed the shelf's limit.
Limitations and Assumptions
Chapter 4 of 4
🔒 Unlock Audio Chapter
Sign up and enroll to access the full audio experience
Chapter Content
Valid mainly for low- to mid-rise buildings. Assumes invariant mode shapes.
Detailed Explanation
While pushover analysis is a valuable method, it has limitations. Primarily, it is most effective for low- to mid-rise buildings, where the assumptions made about structural behavior are more likely to hold true. One major assumption is that the mode shapes (the way a building vibrates) do not change during the analysis, which may not be true in large, complex structures. Therefore, while it can provide useful insights, results should be interpreted with caution, especially in tall or irregular structures.
Examples & Analogies
Consider a team of runners in a relay race. If the team is made up of people of similar heights and builds, they might perform well based on their training and practice. However, if one member suddenly changes to a much taller or shorter runner, the dynamics change, and the team's performance may suffer. Similarly, pushover analysis assumes uniformity in how buildings respond to loads, which may not be accurate for all structures.
Key Concepts
-
Pushover Analysis: A method to assess how structures respond to seismic loads through incremental lateral loading until failure.
-
Capacity Curve: Graphical representation of maximum capacity of a structure concerning displacement.
-
Performance Point: A critical value for assessing whether a structure meets performance objectives based on the seismic demand.
-
Limitations: Recognizing the constraints of pushover analysis, especially for complex or irregular structures.
Examples & Applications
In a pushover analysis of a mid-rise office building, an engineer can visually ascertain how the building's lateral displacement increases with increasing base shear, informing design decisions.
Using the capacity spectrum method, an engineer intersects the capacity curve derived from a pushover analysis with the expected seismic demand curve to find the performance point of a high-rise building.
Memory Aids
Interactive tools to help you remember key concepts
Rhymes
Push, push, like a strong wave, the structure bends but must be brave!
Stories
Imagine a building standing firm against the wind, then trembling under a push like kids on a swing. Each push makes it lean, and the capacity curve tells us how much strength it can glean!
Memory Tools
P-C-P-L: Pushover Curves reveal Performance Limitations.
Acronyms
CAPACITY
Curve Analysis for Performance Assessment of Stability in Tremors Yielding.
Flash Cards
Glossary
- Pushover Analysis
A static nonlinear analysis technique used to assess the seismic performance of structures by applying incremental lateral loads.
- Capacity Curve
A graph that reflects the relationship between base shear and top displacement for a structure during pushover analysis.
- Performance Point
The intersection of the demand and capacity curves, indicating whether the structure can meet performance objectives during seismic events.
- Capacity Spectrum Method
A method used to analyze the seismic behavior of structures by comparing demand and capacity curves.
- Invariant Mode Shapes
The assumption that the mode shapes of a structure do not change under different loading conditions, which can lead to inaccuracies in analysis.
Reference links
Supplementary resources to enhance your learning experience.