
Time-History Analysis and its Applications
Enroll to start learning
You’ve not yet enrolled in this course. Please enroll for free to listen to audio lessons, classroom podcasts and take practice test.
Interactive Audio Lesson
Listen to a student-teacher conversation explaining the topic in a relatable way.
Introduction to Time-History Analysis
🔒 Unlock Audio Lesson
Sign up and enroll to listen to this audio lesson

Today, we will discuss Time-History Analysis and how it plays a vital role in understanding structural responses during earthquakes. Can anyone tell me what Time-History Analysis involves?

Is it about analyzing how buildings react over time during an earthquake?
Exactly! It evaluates how structures respond dynamically to ground motions by applying actual or synthetic earthquake records. What types of records do you think are used in this analysis?

I’ve read about recorded earthquakes like Kobe. Are those used?
Yes, recorded earthquakes such as El Centro, Kobe, and Bhuj are indeed part of this analysis, as well as artificial records. Let’s remember this with the acronym 'RECORD' for Recorded Earthquake and COntrolled Rifts in Data. Can anyone think of another important aspect of Time-History Analysis?

Maybe how it’s different from other methods?
Great point! We'll delve into how it contrasts with other methods like the Response Spectrum Method later. Overall, Time-History Analysis gives a comprehensive response history rather than just peak values. Let’s summarize: Time-History Analysis assesses dynamic responses using historical and synthetic data.
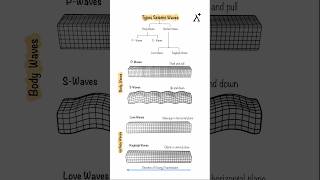
Types of Time-History Records
🔒 Unlock Audio Lesson
Sign up and enroll to listen to this audio lesson

Let's talk about the types of time-history records. What do we mean by recorded earthquakes?

Those are actual seismic events captured using seismometers, right?
Correct! They provide invaluable data for analyzing building responses. Now, what about artificial records?
Are those computer-simulated records that match certain seismic characteristics?
Exactly! Artificial or spectrum-matched records are used to replicate specific features of earthquake motions. We can use the acronym 'ARISE' to remember: Artificial Records in Simulated Earthquake. Why might engineers prefer using these artificial records sometimes?
Because they can control the variables to study specific scenarios?
Exactly! Now let’s summarize: We discussed recorded earthquakes and artificial records. Understanding the types helps us grasp how we conduct analyses.
Linear vs. Nonlinear Time-History Analysis
🔒 Unlock Audio Lesson
Sign up and enroll to listen to this audio lesson
Now, let's differentiate between Linear and Nonlinear Time-History Analysis. Who can explain the linear approach?
It assumes the structure behaves elastically, so it’s simpler and used for serviceability checks?
Correct! Linear Time-History Analysis focuses on elastic response, which simplifies certain conditions. What can you say about Nonlinear Time-History Analysis?
It considers complex behaviors like yielding and plastic deformation, right?
Exactly! Nonlinear Time-History Analysis is more complex and captures real-world issues, requiring iterative numerical algorithms. Let’s use the acronym 'PLASTIC' to remember Nonlinear: Plasticity Leads to Advanced Structural Time Integration Changes. Why is this significant in practical designs?
Because real structures often experience nonlinear behavior during earthquakes?
Exactly! Let's finish by summarizing the key differences between Linear and Nonlinear Time-History Analysis.
Comparison with Response Spectrum Method
🔒 Unlock Audio Lesson
Sign up and enroll to listen to this audio lesson
Finally, let’s compare Time-History Analysis with the Response Spectrum Method. How do they differ?
Time-History Analysis gives a complete history of responses, while Response Spectrum only provides peak values.
Exactly right! Time-History captures every fluctuation in response, whereas Response Spectrum condenses that data into key points. What might be the advantages of this detail?
It helps to better understand how buildings will behave under real seismic conditions!
Well said! It’s crucial for performance-based design in modern engineering. To wrap up, let’s highlight the importance of both methods: Time-History yields complete data; Response Spectrum provides quick assessments.
Introduction & Overview
Read summaries of the section's main ideas at different levels of detail.
Quick Overview
Standard
Time-History Analysis is vital in evaluating how structures react dynamically to seismic activities. This section discusses different types of time-history records, the differences between linear and nonlinear analyses, and contrasts time-history analysis with response spectrum methods to ensure comprehensive structural evaluations.
Detailed
Time-History Analysis is a critical tool in earthquake engineering, enabling engineers to understand the dynamic response of structures under actual or synthetic earthquake motions. This analysis involves using records from past earthquakes, such as El Centro, Kobe, and Bhuj, or artificially generated records that mirror specific seismic characteristics. The analysis can be categorized into Linear Time-History Analysis, which assumes elastic behavior and is useful for serviceability checks, and Nonlinear Time-History Analysis, which captures complex behaviors like yielding and plastic hinge formations. The section also compares the extensive insights provided by time-history analysis with the peak values obtained through the Response Spectrum Method, highlighting its significance in modern seismic design and evaluation practices.
Youtube Videos


Audio Book
Dive deep into the subject with an immersive audiobook experience.
Definition and Purpose
Chapter 1 of 5
🔒 Unlock Audio Chapter
Sign up and enroll to access the full audio experience
Chapter Content
- Time-history analysis evaluates the dynamic response of a structure by applying actual or synthetic ground motion records.
Detailed Explanation
Time-history analysis is a method used in structural engineering to examine how a structure reacts to ground motions over time. This involves applying historic or simulated earthquake data to a model of the structure. The result is a detailed insight into how the structure behaves during seismic events, including how it sways, twists, or deforms. This method is particularly important as it allows engineers to understand and predict the performance of structures during actual earthquakes, rather than relying solely on simplified models or theoretical calculations.
Examples & Analogies
Think of time-history analysis like watching a video of a dancer performing on stage. Just as watching the video helps us see how the dancer moves in response to music, time-history analysis helps engineers visualize how a building reacts to seismic waves, capturing the complexities and variations in motion over time.
Types of Time-History Records
Chapter 2 of 5
🔒 Unlock Audio Chapter
Sign up and enroll to access the full audio experience
Chapter Content
- Recorded earthquakes (e.g., El Centro, Kobe, Bhuj).
- Artificial or spectrum-matched records.
Detailed Explanation
In time-history analysis, there are two main types of records used to simulate ground motion. The first type includes actual records from historical earthquakes, such as those from El Centro, Kobe, and Bhuj, which capture the real seismic forces a structure would face. The second type consists of artificial or spectrum-matched records, which are synthesized to have similar frequency and amplitude characteristics as real earthquakes but are created using mathematical methods. This allows for a controlled analysis while still being reflective of actual seismic conditions.
Examples & Analogies
It's like practicing for a sports game. Athletes often review recordings of their previous games (the recorded earthquakes) to improve their performance. Meanwhile, coaches might also create training simulations (artificial records) that mimic game conditions to prepare them for various scenarios they might face during a match.
Linear Time-History Analysis
Chapter 3 of 5
🔒 Unlock Audio Chapter
Sign up and enroll to access the full audio experience
Chapter Content
- Assumes elastic behavior.
- Useful for serviceability checks.
Detailed Explanation
Linear time-history analysis considers the structure to be elastic, meaning it will return to its original shape after the stress is removed. This type of analysis is particularly useful for ‘serviceability checks’, which ensure that the structure will perform adequately under expected seismic conditions without experiencing significant damage. It is often used in the design stages to verify that the building can withstand minor earthquakes and remain functional.
Examples & Analogies
Imagine a rubber band. When you stretch it gently, it returns to its original shape when you release it. Linear time-history analysis works on similar principles, ensuring that the building can withstand the stress of an earthquake and return to its 'resting' state, just like a rubber band.
Nonlinear Time-History Analysis
Chapter 4 of 5
🔒 Unlock Audio Chapter
Sign up and enroll to access the full audio experience
Chapter Content
- Captures yielding, plastic hinge formation, and energy dissipation.
- Requires complex iterative numerical algorithms.
Detailed Explanation
Nonlinear time-history analysis goes a step further by accounting for materials that yield or deform beyond their elastic limit during strong earthquakes. This analysis includes effects like plastic hinge formation, where structural elements undergo permanent deformation, and energy dissipation, which occurs as a result of yielding materials absorbing seismic energy. As this type is more complex, it requires advanced numerical algorithms to calculate the response of the structure accurately under severe loading conditions.
Examples & Analogies
Think of a car in a collision. Initially, the car’s metal frame can absorb impacts like an elastic material. However, when pushed beyond its limits, it bends and crumples – reflecting a nonlinear response. Nonlinear time-history analysis models this behavior in structures, reflecting real-world consequences of extreme seismic forces.
Comparison with Response Spectrum Method
Chapter 5 of 5
🔒 Unlock Audio Chapter
Sign up and enroll to access the full audio experience
Chapter Content
- Time-history provides complete response history.
- Response spectrum gives peak values only.
Detailed Explanation
The response spectrum method simplifies analysis by providing peak values derived from a variety of ground motions, which estimate the maximum expected responses of structures during seismic events. In contrast, time-history analysis offers a comprehensive view of how a structure behaves over time during an earthquake, capturing every fluctuation and movement. This detailed history includes insights into dynamics that peak values alone cannot provide, making it essential for evaluating critical performance metrics.
Examples & Analogies
Imagine trying to summarize a book by only telling someone the ending; that’s what the response spectrum method does. It gives key peak moments, but you miss out on the entire story. In contrast, time-history analysis is like watching the entire film version of that book, allowing you to experience every scene, twist, and turn, ensuring a deeper understanding of the plot.
Key Concepts
-
Time-History Analysis: A key method for evaluating structural responses to seismic activities.
-
Linear Time-History Analysis: An approach that assumes elastic characteristics of the structure.
-
Nonlinear Time-History Analysis: An advanced technique that addresses structural yielding and nonlinearities.
-
Response Spectrum Method: A simplified method providing peak responses rather than detailed histories.
Examples & Applications
The use of recorded ground motions from the El Centro earthquake to analyze building safety.
Simulating a synthetic record that replicates the frequency content of a typical earthquake for design testing.
Memory Aids
Interactive tools to help you remember key concepts
Rhymes
In an earthquake's might, buildings sway and shake, Time-History, they must take, to know exactly what's at stake.
Stories
Imagine a building in an earthquake: Time-History tells its story of how it sways, bends, and perhaps breaks, reflecting real seismic tales!
Memory Tools
Remember 'PLASTIC'—Plasticity Leads to Advanced Structural Time Integration Changes for Nonlinear Analysis.
Acronyms
Use 'RECORD' for Recorded Earthquake and COntrolled Rifts in Data in Time-History Analysis.
Flash Cards
Glossary
- TimeHistory Analysis
A method to evaluate the dynamic response of structures to earthquake motions using actual or synthetic records.
- Linear TimeHistory Analysis
An analysis that assumes elastic behavior of structures for serviceability checks.
- Nonlinear TimeHistory Analysis
An analysis that captures complex behavior such as yielding and plastic hinge formation using iterative numerical algorithms.
- Response Spectrum Method
A method providing peak response values rather than historical response data.
Reference links
Supplementary resources to enhance your learning experience.