
Methods to Assess Adequacy of Rain Gauge Network
Enroll to start learning
You’ve not yet enrolled in this course. Please enroll for free to listen to audio lessons, classroom podcasts and take practice test.
Interactive Audio Lesson
Listen to a student-teacher conversation explaining the topic in a relatable way.
Double Mass Curve Analysis
🔒 Unlock Audio Lesson
Sign up and enroll to listen to this audio lesson

Today, we're going to discuss the Double Mass Curve Analysis, which helps us check the consistency of rainfall measurements over time. Can someone explain why consistency in measurements is important?

It's crucial because if the data is inconsistent, it could lead to inaccurate hydrology studies or flood forecasts.
Exactly, great point! The Double Mass Curve helps visualize data trends. When we see a break in the curve, it indicates inconsistency, possibly due to factors such as urbanization. Remember, we want consistent data for effective forecasting!

What does it mean if there’s a break in the curve? Does it always indicate a problem?
Good question! A break typically shows that something has changed — either in the rainfall or in how we measure it. It's crucial to investigate further to find the cause of that change.

So, we can use this analysis to identify problems in our network!
Exactly! To summarize, the Double Mass Curve is a vital tool to ensure the reliability of our rainfall data, helping us in effective hydrological management.
Statistical Test for Network Adequacy
🔒 Unlock Audio Lesson
Sign up and enroll to listen to this audio lesson

Now let's dive into another method, the Statistical Test for Network Adequacy. Who can explain the formula we use?

It's N = (Cv)² / E, right? Where N is the number of gauges needed!
Exactly! Can anyone tell me what Cv and E represent?
Cv is the coefficient of variation, which is standard deviation divided by mean rainfall. E is the allowable percentage error, usually around 10%.
That's correct! So, if our existing number of gauges is less than N, what does that tell us?
It means our network isn't adequately capturing rainfall data!
Exactly! Adequate gauge placement is essential for accurate rainfall estimates, ensuring effective hydrologic analysis. Remember, if a network is deemed inadequate, adjustments should be made.
Significance of Assessing Network Adequacy
🔒 Unlock Audio Lesson
Sign up and enroll to listen to this audio lesson
To wrap up our discussion, let’s talk about why it's vital to assess the adequacy of a rain gauge network. What implications does this have?
If our network is inadequate, we could misestimate rainfall, which might lead to poor flood forecasting.
Right! And that impacts areas like agricultural planning and water resource management. The accuracy of our rainfall data is fundamental to many sectors.
So, assessing adequacy isn't just about numbers—it’s about ensuring communities are protected from flooding, right?
Absolutely! Every piece of rainfall data counts when it comes to planning and disaster preparedness. Always remember, rainfall measurement is the backbone of hydrological studies. Let’s keep the importance of network adequacy in mind!
Introduction & Overview
Read summaries of the section's main ideas at different levels of detail.
Quick Overview
Standard
In this section, we explore various methods to assess the adequacy of existing rain gauge networks. Emphasis is placed on statistical techniques such as Double Mass Curve Analysis and Network Adequacy Tests to determine if the current arrangement of rain gauges can effectively capture rainfall data. Evaluating the spatial arrangement ensures we can make accurate hydrological predictions.
Detailed
Methods to Assess Adequacy of Rain Gauge Network
This section addresses the means by which the adequacy of a rain gauge network can be evaluated. Proper evaluation ensures the network effectively captures and represents rainfall data, critical for hydrological studies and forecasting. Here are the primary methods discussed:
1. Double Mass Curve Analysis
- Purpose: This method checks the consistency of rainfall data collected over time.
- Significance: A break or change in the curve signifies an inconsistency, which may indicate issues such as alterations in gauge location or environmental changes like urbanization, adversely affecting data quality.
2. Statistical Test for Network Adequacy
- Formula: This involves a straightforward calculation, where:
where: - N = required number of rain gauges
- Cv = coefficient of variation (standard deviation / mean)
- E = allowable percentage error in estimating mean rainfall (commonly 10%).
- Interpretation: If the number of existing gauges is fewer than required (N), the network is inadequate, necessitating an increase for enhanced accuracy in rainfall measurement.
By utilizing these methods, hydrologists can ensure their rain gauge networks are capable of providing reliable data, ultimately supporting effective flood forecasts and hydrologic modeling.
Youtube Videos


Audio Book
Dive deep into the subject with an immersive audiobook experience.
Evaluating Rain Gauge Networks
Chapter 1 of 3
🔒 Unlock Audio Chapter
Sign up and enroll to access the full audio experience
Chapter Content
To evaluate whether the existing network is sufficient, statistical and probabilistic methods are applied.
Detailed Explanation
In order to determine if the current rain gauge network is adequate, we need to analyze the data collection effectiveness. This is done using statistical and probabilistic methods, which provide mathematical frameworks to objectively measure the performance of the network. These methods can identify gaps or inconsistencies in the data, ensuring that rainfall measurements are both accurate and representative of the area.
Examples & Analogies
Imagine you're trying to gather opinions on a new product from a large group of people. If you only ask a few individuals, you might not get a complete picture of the community's thoughts. Similarly, using statistical methods helps ensure that the sample of rain gauges used gives a fair representation of the rainfall across the entire region.
Double Mass Curve Analysis
Chapter 2 of 3
🔒 Unlock Audio Chapter
Sign up and enroll to access the full audio experience
Chapter Content
• Used to check consistency of rainfall data over a period.
• A break in the curve indicates inconsistency, suggesting changes in the network or environment (e.g., urbanization).
Detailed Explanation
Double Mass Curve Analysis is a graphical technique that helps assess the consistency of rainfall measurements over time. By plotting cumulative rainfall data from two different sources (for example, from two rain gauges), we can identify if the data collection methods or environments have changed. A break or abrupt change in the graphical representation indicates that there may have been an inconsistency that needs further investigation.
Examples & Analogies
Think of a double mass curve as comparing two friends sharing their experiences over the years. If one suddenly describes much fewer fun activities, it might show that something has changed in their life—like moving to a less activity-filled area. The break in the curve signals you to look deeper into their change in circumstances.
Statistical Test for Network Adequacy
Chapter 3 of 3
🔒 Unlock Audio Chapter
Sign up and enroll to access the full audio experience
Chapter Content
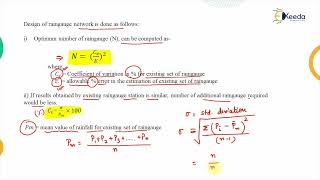
A widely used formula for assessing required number of gauges is:
N = (Cv)^2 / E
Where:
• N = required number of rain gauges
• Cv = coefficient of variation (standard deviation / mean) of rainfall
• E = allowable percentage error in estimation of mean rainfall (generally 10%)
If the current number of gauges is less than N, then the network is inadequate.
Detailed Explanation
This statistical test provides a mathematical formula to calculate the minimum number of rain gauges necessary to ensure reliable rainfall data. The coefficient of variation (Cv) measures how much the rainfall data varies compared to its average, while E represents the acceptable error margin in our calculations. If our existing number of gauges is less than the calculated N value, it indicates the network does not have enough gauges to reliably measure rainfall in that area.
Examples & Analogies
Consider a classroom where a teacher wants to evaluate students' understanding through tests. If the teacher knows that students' scores vary widely, they might decide to administer the tests to a larger group to ensure all voices are heard. Similarly, using the formula, we determine how many gauges we need to truly capture the variability in rainfall.
Key Concepts
-
Double Mass Curve Analysis: A method to visualize and check the consistency of rainfall data.
-
Statistical Test for Network Adequacy: A formula used to calculate the required number of gauges based on data variation and allowable error.
Examples & Applications
Using a Double Mass Curve, a hydrologist can identify inconsistencies caused by urbanization or changes in gauge positioning.
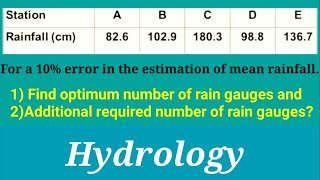
If a region's Cv is calculated as 0.2 and the allowable error is set at 10%, applying the formula will determine how many gauges are needed for proper rainfall estimations.
Memory Aids
Interactive tools to help you remember key concepts
Rhymes
When rainfall data must be strong, use a curve to right the wrong.
Stories
Imagine a farmer with an unreliable rain gauge who misjudges his irrigation needs because his rain data is inconsistent. He learns to use the Double Mass Curve, saving his crops from drought.
Memory Tools
D-C-A: Data Consistency Assessment through Double Mass Curve Analysis.
Acronyms
N-C-E
Number of gauges Needed
Coefficient of Variation
Error allowance.
Flash Cards
Glossary
- Double Mass Curve Analysis
A graphical technique used to assess the consistency of rainfall data over time by plotting cumulative rainfall measurements.
- Coefficient of Variation (Cv)
A statistical measure of the dispersion of the rainfall data, calculated as the standard deviation divided by the mean.
- Allowable Percentage Error (E)
The maximum permissible error in an estimation, commonly set at 10% for rainfall measurement accuracy.
- Statistical Network Adequacy Test
A mathematical assessment method to determine whether a given number of gauges provides sufficient information for accurate rainfall estimation.
Reference links
Supplementary resources to enhance your learning experience.