
Rain Gauge Network
Enroll to start learning
You’ve not yet enrolled in this course. Please enroll for free to listen to audio lessons, classroom podcasts and take practice test.
Interactive Audio Lesson
Listen to a student-teacher conversation explaining the topic in a relatable way.
Introduction to Rain Gauge Networks
🔒 Unlock Audio Lesson
Sign up and enroll to listen to this audio lesson

Welcome everyone! Today, we're diving into rain gauge networks. Can anyone tell me why measuring rainfall is important?

It's important for predicting floods!
Exactly! Accurate rainfall data is crucial for flood forecasting and agricultural planning. Let’s discuss the primary objectives of a rain gauge network. Who can name one?

To measure rainfall at different locations?
Right! They also help in estimating areal precipitation and studying the distribution of rainfall over time. Remember the acronym RAIN—Rainfall Analysis and Interpreted Networks!

That’s a good memory aid, thanks!
Let’s summarize what we learned so far: rain gauge networks measure point rainfall, help in estimating areal precipitation, and identify rainfall trends.
Factors Influencing Network Design
🔒 Unlock Audio Lesson
Sign up and enroll to listen to this audio lesson

Moving forward, let’s talk about the factors that influence the design of rain gauge networks. Can anyone mention a factor?

Topography?
Correct! Topographical features, like mountains, can significantly affect rainfall capture. What else might affect placement?
The purpose of the study?
Yes! Flood studies require more gauges for higher accuracy. To help remember, think of the acronym TOP—Topography, Objective, and Proximity for Accessibility!
I like that! It helps me remember the critical design factors.
Great! So, to summarize, the design is affected by topography, the purpose of the study, and other logistical factors.
Assessing Network Adequacy and Density Guidelines
🔒 Unlock Audio Lesson
Sign up and enroll to listen to this audio lesson
Now, let’s discuss how we assess the adequacy of a rain gauge network. What assessments can we perform?
The Double Mass Curve Analysis?
Correct! This method checks the consistency of data. Let’s also look at density guidelines from WMO. Student_4, can you share the recommended density in mountainous regions?
One gauge per 100 km².
Excellent! Density requirements help ensuring enough coverage to capture rainfall variability. Remember the acronym WMO—World Metrics of Organization for density standards!
These memory aids are really helping me!
Fantastic! Always remember, assessing adequacy involves analyzing rainfall data consistency using statistical methods.
Methods to Estimate Missing Rainfall Data
🔒 Unlock Audio Lesson
Sign up and enroll to listen to this audio lesson
We often face missing rainfall data. What methods can we use to estimate those values?
The Arithmetic Mean Method?
Exactly! It’s simple and effective for uniform rainfall areas. Can anyone remind me when we use the Normal Ratio Method?
When the normal annual rainfall at surrounding stations differs significantly!
Perfect! To remember these methods, think of the acronym MAINS—Mean, Arithmetic, Inverse distance, Normal ratio, and Spatial variation!
I’ll remember that! What about the Inverse Distance Method?
Good question! It weighs the data according to the distances. Let's summarize: we use these methods to deal with missing data effectively.
Challenges and Technological Advancements
🔒 Unlock Audio Lesson
Sign up and enroll to listen to this audio lesson
Lastly, let’s tackle the challenges in rain gauge networks. What are some errors that can occur?
Instrumental and observational errors?
Exactly! How about those caused by technology?
Temporal errors?
Great! New technologies, like automatic rain gauges and weather radar systems, help mitigate these errors. Remember the acronym TIE—Technology Improving Estimation!
That’s a clever way to remember!
To wrap up, we covered errors in networks and how modern advancements improve accuracy. Always stay curious about these innovations!
Introduction & Overview
Read summaries of the section's main ideas at different levels of detail.
Quick Overview
Standard
Rain gauge networks are critical for collecting precise rainfall data essential for hydrologic studies, planning, and predictability of weather patterns. This section outlines key concepts surrounding the network’s design, influencing factors, density requirements according to WMO and Indian guidelines, methods for assessing network adequacy, and techniques for estimating missing data.
Detailed
Rain Gauge Network
Rain gauge networks are vital for measuring rainfall accurately across various geographical areas. They help in hydrologic studies, flood forecasting, agricultural planning, and hydraulic structure design. Effective rainfall analysis relies on the optimal placement and number of rain gauges, which capture spatial variability and enable reliable data collection. The objectives of these networks include measuring point rainfall at multiple sites, estimating areal precipitation, studying rainfall distribution, and detecting extreme weather events.
Factors Influencing Design
The design of a rain gauge network is influenced by several factors, including:
- Topography: More gauges in mountainous regions to contend with orographic effects.
- Climatic Variability: Areas with variable rainfall patterns require denser networks.
- Purpose of Study: Higher accuracy for critical studies like flood forecasting means needing more gauges.
- Catchment Area Size: Larger areas call for more gauges for adequate representation.
- Accessibility: Practical considerations for gauge placement and maintenance.
Density Guidelines
The World Meteorological Organization (WMO) and Indian Meteorological Department (IMD) provide different minimum density standards based on region type, signaling higher gauge requirements in urban and mountainous areas.
Assessing Network Adequacy
The adequacy of a rain gauge network can be evaluated using statistical methods like the Double Mass Curve Analysis and applying formulas to calculate the required number of gauges based on rainfall variability.
Estimating Missing Data
In the event of missing data, several methods can be employed, such as the Arithmetic Mean Method for uniform regions and the Inverse Distance Method, which considers how distance affects rainfall data accuracy.
Conclusion
A well-designed rain gauge network balances cost and accuracy, ensuring effective rainfall measurement essential for various applications including flood prediction and agricultural management.
Youtube Videos


Audio Book
Dive deep into the subject with an immersive audiobook experience.
Introduction to Rain Gauge Networks
Chapter 1 of 11
🔒 Unlock Audio Chapter
Sign up and enroll to access the full audio experience
Chapter Content
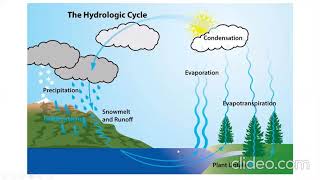
Accurate measurement of rainfall is fundamental to hydrologic studies, flood forecasting, agricultural planning, and the design of hydraulic structures. A rain gauge network refers to the spatial arrangement and density of rain gauges deployed over a region to capture precipitation data.
Detailed Explanation
Rainfall measurement is critical in various fields such as hydrology (the study of water movement), agriculture, and flood prediction. A rain gauge network consists of various rain gauges placed strategically in an area to ensure accurate and comprehensive rainfall data is collected. The placement and density of these gauges are essential for effective rainfall analysis, including understanding how much rain falls over a specific area and predicting runoff, which is the flow of water from rainwater or melted snow.
Examples & Analogies
Think of a rain gauge network like a team of scouts in a forest. Each scout (gauge) is positioned at different spots to observe the rain in their area. If scouts are spread too far apart, they might miss spotting important rain patterns. However, if they are too close together, they may be redundant, which isn't efficient. The goal is to find the right balance to ensure the whole area is monitored effectively.
Key Objectives of a Rain Gauge Network
Chapter 2 of 11
🔒 Unlock Audio Chapter
Sign up and enroll to access the full audio experience
Chapter Content
Key objectives of a rain gauge network:
• To measure point rainfall at various locations
• To estimate areal precipitation
• To study spatial and temporal distribution of rainfall
• To detect anomalies and extreme weather events
Detailed Explanation
A rain gauge network has several important objectives: First, it collects rainfall data from different locations, giving a point measurement. Second, this data can be used to estimate total rainfall over a larger area, known as areal precipitation. Third, the network allows researchers to analyze how rainfall varies in both time and space, identifying patterns or trends. Lastly, these networks are crucial for detecting unusual weather events, like sudden heavy rainfalls that could lead to floods.
Examples & Analogies
Imagine your school has multiple weather stations set up in different classes, all recording temperatures. If one class reports high temperatures but others do not, it may indicate a heating issue (an anomaly). Similarly, a rain gauge network helps spot such discrepancies in rainfall, which is critical in anticipating potential flooding.
Factors Influencing Rain Gauge Network Design
Chapter 3 of 11
🔒 Unlock Audio Chapter
Sign up and enroll to access the full audio experience
Chapter Content
When designing a rain gauge network, the following factors are considered:
• Topography: Mountainous or hilly regions require denser networks due to orographic effects.
• Climatic variability: Regions with high rainfall variability need more gauges.
• Purpose of study: Flood studies demand higher accuracy and thus denser networks.
• Size of catchment area: Larger areas require more gauges for adequate representation.
• Accessibility and logistics: Influence gauge placement and maintenance feasibility.
Detailed Explanation
Designing a rain gauge network involves considering several factors. Firstly, the landscape (topography) plays a significant role; mountainous areas may need more gauges to capture the unique rainfall patterns caused by height differences (orographic effects). Areas with highly variable weather also require more gauges for precise data. Additionally, the intended use of the network—such as flood prediction—may demand a denser setup for better accuracy. Larger catchment areas warrant more gauges for proper representation, while logistical concerns ensure that gauges can be easily accessed and maintained.
Examples & Analogies
It's like planning a treasure hunt. If the terrain is rugged, you will need more guides (gauges) to ensure everyone can find their way to the clues (data). If it’s a flat area, fewer guides may suffice. Similarly, your goal (like finding treasure) dictates how many guides you need based on the area you're exploring.
Density of Rain Gauge Network: Guidelines
Chapter 4 of 11
🔒 Unlock Audio Chapter
Sign up and enroll to access the full audio experience
Chapter Content
7.3.1 WMO Guidelines
The World Meteorological Organization (WMO) provides general guidelines for the minimum recommended density of rain gauges:
Type of Region Min. No. of Gauges per sq. km
Flat Region 1 per 625 km2
Hilly Region 1 per 250 km2
Mountainous Region 1 per 100 km2
Urban Areas 1 per 50 km2
7.3.2 Indian Standards
The Indian Meteorological Department (IMD) also gives guidelines, particularly for different river basin regions and micro-watersheds. The IMD standards are often more stringent for hydrological design.
Detailed Explanation
According to the World Meteorological Organization, the recommended number of rain gauges varies by region. In flat regions, one gauge is needed per 625 square kilometers, while hilly and mountainous regions require denser arrangements to accommodate the varied rainfall patterns. Urban areas, with their unique climatic challenges, require the highest density of gauges. The Indian Meteorological Department sets similar rules but often adopts stricter standards tailored to specific regional needs, ensuring that the data collected is suitable for hydrological designs.
Examples & Analogies
Imagine a city with lots of tall buildings (urban). It needs more weather reporters than a flat suburb. If you have one reporter for every block in the city (high-density), you get detailed reports every few meters, while in the suburbs (low-density), one could cover a larger area effectively. Adjusting the number of reporters based on the environment helps achieve the best coverage.
Methods to Assess Adequacy of Rain Gauge Network
Chapter 5 of 11
🔒 Unlock Audio Chapter
Sign up and enroll to access the full audio experience
Chapter Content
To evaluate whether the existing network is sufficient, statistical and probabilistic methods are applied.
7.4.1 Double Mass Curve Analysis
• Used to check consistency of rainfall data over a period.
• A break in the curve indicates inconsistency, suggesting changes in the network or environment (e.g., urbanization).
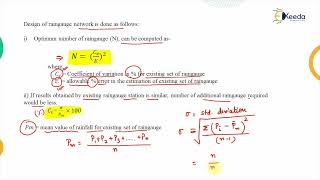
7.4.2 Statistical Test for Network Adequacy
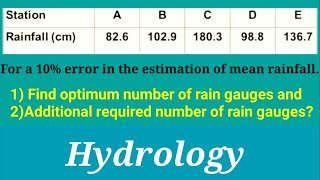
A widely used formula for assessing the required number of gauges is:
\[ N = \frac{(Cv)^2}{E} \]
Where:
• N = required number of rain gauges
• Cv = coefficient of variation (standard deviation / mean) of rainfall
• E = allowable percentage error in estimation of mean rainfall (generally 10%)
If the current number of gauges is less than N, then the network is inadequate.
Detailed Explanation
To determine if a rain gauge network is adequate, various statistical methods are utilized. One method is the Double Mass Curve Analysis, which helps to identify inconsistencies in rainfall data over time. If there's a deviation or 'break' in the curve, it signifies potential issues with gauge reliability or environmental changes. Another statistical method uses a formula to calculate the minimum number of gauges needed based on data variability (the coefficient of variation) and the acceptable error in rainfall estimates. If the current gauge count is below this calculated number, the network is deemed insufficient.
Examples & Analogies
Think about a classroom where students report their average test scores. If one student starts reporting wildly different scores, teachers may need to investigate (the break in the curve). They can also compare the number of students (gauges) to the class size formula to ensure adequate data representation. If too few students report scores compared to the total number expected, they may need more student assessors in the future.
Interpolation and Estimation of Missing Rainfall Data
Chapter 6 of 11
🔒 Unlock Audio Chapter
Sign up and enroll to access the full audio experience
Chapter Content
Rainfall records may have missing values due to equipment failure or recording errors. These can be estimated using the following methods:
7.5.1 Arithmetic Mean Method
n 1 X
P = P
x n i
i=1
Where:
• P = missing rainfall value
x
• P = known rainfall values from surrounding stations
i
7.5.2 Normal Ratio Method
Used when the normal annual rainfall at surrounding stations differs significantly (by more than 10%).
n (cid:18) (cid:19)
P = 1 X N x ×P
x n N i
i=1
Where:
• N = normal rainfall at the missing station
x
• N = normal rainfall at station i
i
• P = recorded rainfall at station i
i
7.5.3 Inverse Distance Method
Weights the rainfall based on the inverse square of the distance between known stations and the one with missing data.
Pn Pi
i=1 d2
P = i
x Pn 1
i=1 d2
i
Where:
• d = distance from station i to the station with missing data.
Detailed Explanation
Missing data in rainfall records can occur for various reasons; to address this, several methods can be used for estimation. The Arithmetic Mean Method uses the average rainfall data from nearby gauges to fill in gaps. The Normal Ratio Method applies when there are significant differences in normal rainfall between stations, providing a way to make adjustments. Lastly, the Inverse Distance Method assigns more weight to nearby stations when estimating the missing data, using the distance to influence the reliability of the measurement.
Examples & Analogies
If a student's report card has a missing grade, teachers can figure out an estimated score using the average of other grades, much like the Arithmetic Mean Method. If they notice a student's scores vary significantly from peers (Normal Ratio Method), they adjust accordingly. Alternatively, if friends close by have reliable scores, they can consider those more heavily (Inverse Distance Method).
Optimum Rain Gauge Network Design
Chapter 7 of 11
🔒 Unlock Audio Chapter
Sign up and enroll to access the full audio experience
Chapter Content
The goal is to balance cost and accuracy. An optimum network should minimize:
• Cost of installation and maintenance
• Estimation error in areal precipitation
Key steps:
1. Analyze rainfall variability using historical data
2. Apply the coefficient of variation and allowable error to calculate required number
3. Use geostatistical methods (e.g., Kriging) to evaluate spatial coverage
4. Implement in stages and monitor performance
Detailed Explanation
Designing an optimum rain gauge network requires balancing two critical aspects: cost and accuracy. To achieve this, costs for setting up and maintaining the network must be minimized while ensuring that the estimation of rainfall is as accurate as possible. Steps include examining historical rainfall data to understand variability, using the coefficient of variation to calculate how many gauges are necessary, applying sophisticated methods like Kriging for spatial analysis, and implementing the network gradually while keeping track of its performance.
Examples & Analogies
Consider a restaurant aiming to offer the best menu at the least expense. They analyze which dishes sell the best (historical data), then decide how many chefs to hire (coefficient of variation) to maintain quality without overspending (cost). They may introduce new dishes gradually, analyzing customer reactions (monitoring performance) to ensure the best outcomes at the lowest costs.
Network Layout and Spatial Coverage
Chapter 8 of 11
🔒 Unlock Audio Chapter
Sign up and enroll to access the full audio experience
Chapter Content
The spatial arrangement of gauges can follow patterns like:
• Uniform grid: Simple but may not consider natural features
• Topography-based layout: Prioritizes hilltops, valleys, slopes, etc.
• Random or stratified random sampling: Involves statistical randomness
• Watershed-based layout: Places gauges at hydrologically significant points
Use of GIS and remote sensing helps visualize and optimize the network.
Detailed Explanation
The layout of a rain gauge network can vary based on its objectives and the natural landscape. A uniform grid is straightforward to implement, but it doesn’t always account for geographic features that affect rainfall. A topography-based approach places gauges in areas like hilltops or valleys to capture key rainfall variations. Random sampling methods introduce statistical randomness, while a watershed-based layout focuses on significant hydrological sites. Geographic Information Systems (GIS) and remote sensing tools can greatly assist in optimizing these layouts.
Examples & Analogies
Imagine placing cameras to capture wildlife. A grid of cameras (uniform layout) might miss animals in thickets (natural features). Instead, placing cameras on hills (topography-based layout) or using a strategy to ensure you cover hotspots (watershed-based layout) increases your chances of capturing key moments. Tools like maps help decide the best camera placement to ensure effective coverage.
Errors and Limitations in Rain Gauge Networks
Chapter 9 of 11
🔒 Unlock Audio Chapter
Sign up and enroll to access the full audio experience
Chapter Content
Rain gauge networks face multiple sources of error:
• Instrumental Errors: Calibration, mechanical failure, clogging
• Observational Errors: Human error in manual readings
• Spatial Errors: Rainfall may vary between gauges (especially during convective storms)
• Temporal Errors: Time gaps in data collection
Modern automation and telemetry can reduce such errors.
Detailed Explanation
Like any measurement system, rain gauge networks are prone to various errors. Instrumental errors may arise from faulty calibration or equipment failures. Observational errors can occur due to incorrect manual data collection. Spatial variability (especially during storms) can cause discrepancies between gauges, while time gaps in data can lead to incomplete data sets. However, advancements in automation and telemetry can help reduce these errors, offering more accurate and timely readings.
Examples & Analogies
Consider a fitness tracker that sometimes miscounts steps (instrumental errors). If you don’t wear it properly (observational errors), it might undercount. If there are extreme winds (spatial errors) affecting where you run, or if you forget to wear it one day (temporal errors), you won't get the full picture. Modern fitness apps can now connect to multiple sensors (automation and telemetry) to provide a much clearer view of your activity.
Technological Advancements in Rainfall Measurement
Chapter 10 of 11
🔒 Unlock Audio Chapter
Sign up and enroll to access the full audio experience
Chapter Content
With the advent of technology, traditional rain gauges are now supplemented with:
• Automatic Rain Gauges (ARGs): Tipping bucket or weighing-type sensors
• Weather Radar Systems: Estimate rainfall intensity and area coverage in real time
• Satellite-Based Precipitation Measurement: Useful for inaccessible or oceanic regions
• IoT-Enabled Rain Gauges: Send real-time data for hydrological modeling
These advances complement ground networks but still require validation against conventional data.
Detailed Explanation
Technology has significantly enhanced the capabilities of rainfall measurement beyond traditional methods. Automatic Rain Gauges (ARGs) can quickly collect and report data without human intervention, while weather radar systems provide immediate rainfall estimates over large areas. Satellite-based measurements are particularly valuable in hard-to-reach locations, and IoT-enabled rain gauges offer real-time connectivity for data collection. However, it's essential to cross-validate these technological measurements with traditional data to ensure accuracy.
Examples & Analogies
Think of how smartphones have evolved GPS systems. While traditional maps (ground networks) are still useful for navigation, GPS apps (technological advancements) provide real-time directions and traffic updates. However, you wouldn’t rely solely on GPS without sometimes checking your map to ensure accuracy. This combination leads to better navigation, similar to how new technologies enhance rainfall measurement.
Applications of Rain Gauge Networks
Chapter 11 of 11
🔒 Unlock Audio Chapter
Sign up and enroll to access the full audio experience
Chapter Content
• Hydrological modeling and flood prediction
• Irrigation planning and agricultural water management
• Reservoir operation and spillway design
• Urban stormwater management
• Climate studies and drought monitoring
Effective rain gauge networks form the backbone of water resource planning and disaster mitigation efforts.
Detailed Explanation
Rain gauge networks serve a fundamental role in various fields. They are crucial for hydrological modeling, which includes predicting floods, managing irrigation needs in agriculture, and planning reservoir operations. Additionally, they help manage urban stormwater to prevent flooding and play a vital part in climate research, including studies on droughts. The effectiveness of these efforts relies heavily on accurate and reliable rainfall data.
Examples & Analogies
Consider a city planning a new park. Data from rain gauges help determine how much irrigation is needed, how to manage stormwater runoff, and even assess flooding risks if it rains heavily. This data is akin to an architect using accurate soil studies when designing a building; it ensures that every decision made is based on solid, empirical evidence.
Key Concepts
-
Rain Gauge Network: A collection of rain gauges distributed to accurately measure rainfall across regions.
-
Spatial Variability: The variation in rainfall between different geographical locations affecting data reliability.
-
Density Guidelines: Recommended standards by meteorological organizations to ensure adequate rainfall data collection.
-
Double Mass Curve: A technique to examine the consistency of rainfall data over time.
-
Interpolation: Techniques to estimate missing rainfall data based on surrounding measurements.
Examples & Applications
An urban area requires one rain gauge for every 50 km² to effectively rain gauge network density.
In mountainous regions, rainfall capture can be optimized by placing gauges on hilltops and ridgelines to gather more relevant data.
Memory Aids
Interactive tools to help you remember key concepts
Rhymes
Rain, rain, come again; let the gauges show our gain!
Stories
Imagine a farmer who needs rain for his crops. He deploys rain gauges all over his fields to ensure every drop counts, knowing each gauge tells a story of rainfall.
Memory Tools
TOP—Topography, Objective, Proximity: Remember these three when designing a rain gauge network.
Acronyms
RAIN—Rainfall Analysis and Interpreted Networks
way to recall the purpose of rain gauge networks.
Flash Cards
Glossary
- Rain Gauge Network
A collection of rain gauges distributed across a specific area to measure precipitation accurately.
- Spatial Variability
Variations in rainfall amounts across different geographical locations.
- Density Guidelines
Standards provided by meteorological organizations to determine the minimum number of gauges required in various regions.
- Double Mass Curve Analysis
A method used to evaluate the consistency of rainfall data over time by graphing the cumulative data against another station.
- Interpolation
The process of estimating missing or unknown values based on known data points.
Reference links
Supplementary resources to enhance your learning experience.