
Optimum Rain Gauge Network Design
Enroll to start learning
You’ve not yet enrolled in this course. Please enroll for free to listen to audio lessons, classroom podcasts and take practice test.
Interactive Audio Lesson
Listen to a student-teacher conversation explaining the topic in a relatable way.
Analyzing Rainfall Variability
🔒 Unlock Audio Lesson
Sign up and enroll to listen to this audio lesson

Today, we're going to start with understanding how we analyze rainfall variability. This is the first step in designing an optimum rain gauge network.

Why is it important to analyze historical data?
Great question! Analyzing historical data helps us understand the patterns and variability in precipitation, which informs our gauge placement.

So, we look at past rainfall to predict future needs?
Exactly! By examining how rainfall has varied, we can plan for areas that need more coverage. A good memory aid might be: 'History repeats, rainfall reveals!'
Calculating the Required Number of Gauges
🔒 Unlock Audio Lesson
Sign up and enroll to listen to this audio lesson

Now, let's move on to calculating the required number of rain gauges. This is crucial because an inadequate number of gauges can lead to erroneous data.

How do we calculate that number?
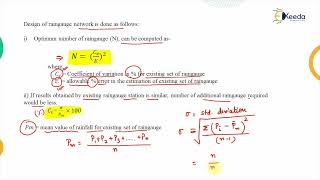
We use the formula N = (Cv^2) / E, where Cv is the coefficient of variation and E is the allowable error percentage.

Can we break that down a bit?
Of course! The coefficient of variation helps us understand how much rainfall varies, while E helps us set a threshold for how much error we can accept.
So, higher variability means we need more gauges?
That's right! Higher variability requires a denser network to capture the differences accurately.
Evaluating Spatial Coverage
🔒 Unlock Audio Lesson
Sign up and enroll to listen to this audio lesson
Next, let’s discuss evaluating spatial coverage, which is where geostatistical methods come into play.
What are geostatistical methods?
Great question! These are statistical techniques that help us analyze spatial data. A common method is Kriging.
Can you explain how Kriging helps?
Certainly! Kriging allows us to predict unknown values based on known data points. This is very useful for determining optimal gauge placements.
So we can make smarter decisions on where to place gauges?
Exactly! It enhances accuracy and efficiency in our design.
Implementation in Stages
🔒 Unlock Audio Lesson
Sign up and enroll to listen to this audio lesson
Finally, let’s talk about implementation in stages. Why do you think that's necessary?
I think it would help to adjust if something goes wrong?
Exactly! Gradually implementing the network allows us to monitor performance and make adjustments.
It sounds like a flexible approach!
Yes! Flexibility is key in ensuring efficiency and effectiveness in network design.
Can we use short reviews after each stage to track progress?
That's a brilliant idea! Regular assessments can help in fine-tuning the network.
Introduction & Overview
Read summaries of the section's main ideas at different levels of detail.
Quick Overview
Standard
In this section, the goal of designing an optimum rain gauge network is explored, emphasizing the need to minimize costs while ensuring accurate measurements of areal precipitation. The step-by-step approach includes analyzing historical rainfall data, evaluating spatial coverage with geostatistical methods, and suggesting a phased implementation.
Detailed
Detailed Summary
The design of an optimum rain gauge network is critical for accurate rainfall measurement, which is essential for various hydrological analyses. This section highlights the importance of balancing installation and maintenance costs with the need for precise data. To achieve this, the following key steps are outlined:
- Analyze Rainfall Variability: Historical rainfall data is analyzed to understand patterns and variability in precipitation, using metrics such as the coefficient of variation (Cv).
- Calculate Required Number of Gauges: Based on the acceptable level of estimation error, the required number of gauges is calculated to ensure reliable data. This step is crucial as it directly impacts the network's ability to capture rainfall accurately.
- Spatial Coverage Evaluation: Geostatistical methods, particularly Kriging, are employed to assess how well the gauges cover the area under study. This statistical approach helps in identifying optimal locations for gauge placement.
- Implementation in Stages: The deployment of the network should be gradual, allowing for performance monitoring and adjustments based on the accuracy of the data collected.
This structured approach is vital for creating a robust rain gauge network that meets the needs of hydrological research and flood prediction.
Youtube Videos


Audio Book
Dive deep into the subject with an immersive audiobook experience.
Balancing Cost and Accuracy
Chapter 1 of 5
🔒 Unlock Audio Chapter
Sign up and enroll to access the full audio experience
Chapter Content
The goal is to balance cost and accuracy. An optimum network should minimize:
- Cost of installation and maintenance
- Estimation error in areal precipitation
Detailed Explanation
In designing a rain gauge network, it's vital to strike a balance between how much it costs to set up and run the network and the accuracy of the rainfall measurements it provides. High costs can limit the number of gauges deployed, while poor accuracy can lead to wrong data that can have serious implications, especially in flood forecasting and agricultural planning.
Examples & Analogies
Imagine if a farmer wants to irrigate their crops. They need accurate rainfall data to know how much water to provide. If the rain gauge network is too sparse or too costly to maintain, it may provide misleading data, causing the farmer either to overwater or underwater the crops, which can lead to crop loss.
Analyzing Rainfall Variability
Chapter 2 of 5
🔒 Unlock Audio Chapter
Sign up and enroll to access the full audio experience
Chapter Content
- Analyze rainfall variability using historical data
Detailed Explanation
Historical data on rainfall patterns provides insight into how rainfall varies across different times and locations. Analysts assess this variability to understand the unique characteristics of the region's precipitation, guiding how many gauges are needed and where to place them.
Examples & Analogies
Think of a family trying to budget their grocery expenses based on spending patterns over several months. If they observe that their expenses fluctuate significantly during holidays, they would allocate their budget accordingly, just as hydrologists must adjust gauge placements based on seasonal rainfall patterns.
Calculating Required Number of Gauges
Chapter 3 of 5
🔒 Unlock Audio Chapter
Sign up and enroll to access the full audio experience
Chapter Content
- Apply the coefficient of variation and allowable error to calculate required number
Detailed Explanation
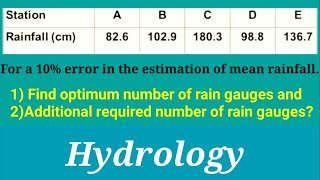
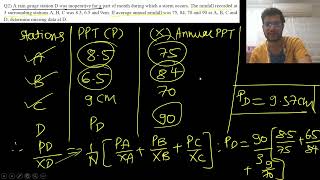
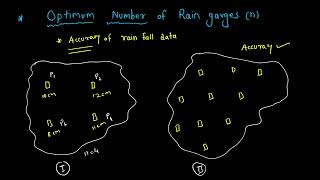
The coefficient of variation (Cv) is a statistical measure that represents the level of risk or variability in rainfall. By applying this alongside a predetermined allowable error (often 10%), planners can determine how many gauges are necessary to ensure reliable estimation of mean rainfall across the area. High variability means more gauges are needed.
Examples & Analogies
Imagine preparing for a road trip and trying to estimate how many gas stations you'll need to stop at based on how frequently you run low on fuel. If your past trips show that gas consumption varies widely, you'll plan to stop more frequently, just like planners rely on the coefficient of variation for deciding gauge density.
Using Geostatistical Methods
Chapter 4 of 5
🔒 Unlock Audio Chapter
Sign up and enroll to access the full audio experience
Chapter Content
- Use geostatistical methods (e.g., Kriging) to evaluate spatial coverage
Detailed Explanation
Geostatistical methods, such as Kriging, allow for the interpolation of rainfall data based on the spatial arrangement of existing gauges. This approach helps to predict rainfall in areas where no gauges are present, ensuring that the entire region is adequately covered and safe from unforeseen discrepancies in data.
Examples & Analogies
This is like filling in a puzzle with a few pieces missing. You can estimate what the missing pieces look like based on the shapes and colors of the surrounding pieces. Similarly, geostatistical methods predict rainfall data in areas lacking direct measurements.
Implementing in Stages and Monitoring Performance
Chapter 5 of 5
🔒 Unlock Audio Chapter
Sign up and enroll to access the full audio experience
Chapter Content
- Implement in stages and monitor performance
Detailed Explanation
The design of a rain gauge network should be implemented in phases. This staged approach allows for adjustments based on initial findings and performance evaluations. Continuous monitoring can identify any inconsistencies or errors that arise, thereby allowing for timely corrections to be made if necessary.
Examples & Analogies
Think of developing a new recipe. Cooking a dish section by section lets you taste and adjust flavors at each step. Similarly, implementing the network in stages allows for adjustments based on how well the system captures rainfall data before fully deploying the entire network.
Key Concepts
-
Optimum Network Design: A network should be planned to balance cost and accuracy in rainfall measurement.
-
Historical Data Analysis: It is crucial to analyze historical rainfall data to understand patterns and variability.
-
Spatial Coverage: Evaluating spatial coverage using geostatistical methods helps ensure adequate measurement across areas.
-
Staged Implementation: Deploying the network in stages allows ongoing monitoring and adjustment.
Examples & Applications
An example of a historical analysis might involve observing rainfall patterns over a decade to identify trends and variability before placing new gauges.
When using Kriging, one could take rainfall data from existing gauges to predict rainfall in unmeasured areas, optimizing gauge placement.
Memory Aids
Interactive tools to help you remember key concepts
Rhymes
To measure rain with great precision, set your gauges with careful vision.
Stories
Imagine you are a rain detective, analyzing patterns to choose the best spots for your gauges to ensure no drop goes unwatched.
Memory Tools
Remember 'A-C-S-I': Analyze data, Calculate gauges, Spatial coverage, Implement in stages.
Acronyms
G-C-A-I
Gauge
Calculate number
Analyze variance
Implement gradually.
Flash Cards
Glossary
- Rain Gauge Network
A spatial arrangement of rain gauges distributed over an area to measure precipitation.
- Coefficient of Variation (Cv)
A statistical measure of the dispersion of rainfall data, calculated as the ratio of standard deviation to mean.
- Geostatistical Methods
Statistical techniques used to analyze and predict spatial data, helping to improve gauge placement.
- Kriging
A geostatistical method that uses known data points to predict unknown values based on spatial correlations.
- Areal Precipitation
The average amount of precipitation over a specific area, derived from point measurements.
Reference links
Supplementary resources to enhance your learning experience.