
Analyzing Combined Transfer Function
Enroll to start learning
You’ve not yet enrolled in this course. Please enroll for free to listen to audio lessons, classroom podcasts and take practice test.
Interactive Audio Lesson
Listen to a student-teacher conversation explaining the topic in a relatable way.
Introduction to Transfer Functions
🔒 Unlock Audio Lesson
Sign up and enroll to listen to this audio lesson

Today, we're going to explore transfer functions in R-C and C-R circuits. The transfer function represents the relationship between input and output in the Laplace domain. Can anyone tell me what we mean by the Laplace domain?

Isn't it where we represent time domain functions in terms of complex frequency?
Exactly! In the Laplace domain, we can easily manipulate the circuit equations. We first determine the impedance of the resistor and capacitor, then we can derive our transfer function. What do we get when we take the output voltage over input voltage?

I think it's V(s) = some function of s?
You're right! For the R-C circuit, we often find it’s of the form H(s) = 1/(1+sRC). This is crucial for analyzing frequency response. Can anyone tell me what s represents?

It's the complex frequency, usually expressed as s = σ + jω.
Perfect! Now, let's talk about how we transition from Laplace to Fourier domain. When we replace s with jω, that helps us find the frequency response.

So does that mean we can see how the circuit reacts to different frequencies?
Exactly! In fact, the frequency response helps us identify if the circuit behaves like a low-pass or high-pass filter. Let's summarize: we learned about the significance of the transfer function, how to express it in the Laplace domain, and the importance of switching to the jω domain.
Magnitude and Phase Response
🔒 Unlock Audio Lesson
Sign up and enroll to listen to this audio lesson

Now, let’s discuss the magnitude and phase responses in more detail. At low frequencies, what can we expect the magnitude response to be?
It should be close to 1 if we ignore the capacitor's effect.
But as we increase the frequency, the capacitor starts dominating, and then it decreases, right?
Correct! The behavior changes such that at high frequencies, the magnitude follows a 1/ω nature, forming a hyperbolic curve. What about the phase shift at low frequencies?
It’s nearly 0°, indicating no phase shift initially.
Well done! As we reach the cutoff frequency, the phase shifts towards -45°, and eventually, at higher frequencies, approaches -90°. This is fundamental for analyzing if a circuit can effectively transmit the desired signals.
So these characteristics help us design circuits to ensure they fit within desired frequency ranges!
Exactly! Summarizing, we've explored how the magnitude and phase shifts of a circuit behave at different frequencies, reinforced by the important role of cutoff frequencies.
Bode Plot Analysis
🔒 Unlock Audio Lesson
Sign up and enroll to listen to this audio lesson
Now, let’s look at Bode plots, which are essential for displaying the frequency response of our circuits. Who can tell me what a Bode plot consists of?
It has two plots—one for magnitude and one for phase!
Exactly! Bode plots help visualize the response over a wide frequency range. Once we plot the gain in decibels, what happens at the corner frequency of a low-pass filter?
The gain drops to -3 dB.
Correct! And this signifies a significant point in our graph. The slope varies as well beyond this frequency. Can anyone recall the slope beyond this point?
I think it’s -20 dB per decade.
Well done! Bode plots simply allow us to see the relationship between frequency and gain or phase in a straightforward manner. To summarize, Bode plots provide a practical way to visualize magnitude and phase shifts which are crucial in frequency domain analysis.
Combining R-C and C-R Circuits
🔒 Unlock Audio Lesson
Sign up and enroll to listen to this audio lesson
Finally, let’s bring together everything we’ve learned about combined circuits. When R-C and C-R circuits are cascaded, what challenges might we run into?
There could be loading effects between them!
Exactly! This can affect circuit performance and distort responses. What strategies can we use to mitigate this?
Maybe use a voltage-dependent voltage source to isolate them?
Great answer! By isolating stages, we ensure each operates optimally without interference. This leads us to better overall frequency response characteristics. Can anyone summarize the key takeaway from our discussion?
We learned the importance of transfer functions, frequency responses, and how they interact when combining circuits!
Excellent summary! So, in summary, we explored how cascaded circuits function together and the importance of mitigating loading effects for improved circuit performance.
Introduction & Overview
Read summaries of the section's main ideas at different levels of detail.
Quick Overview
Standard
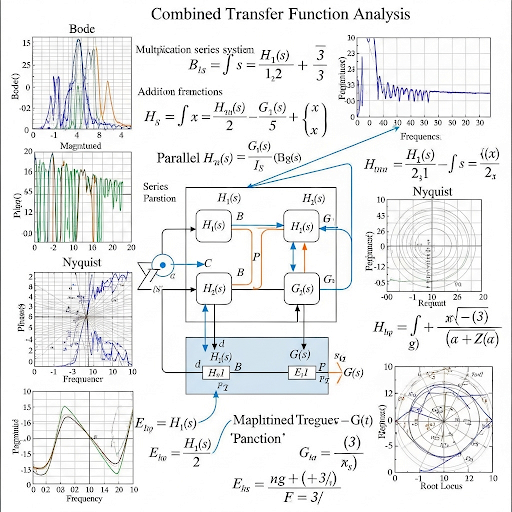
The section explores the analysis of frequency responses for combined R-C and C-R circuits, detailing how their transfer functions can be derived and how the poles influence the behavior of these circuits. The significance of corner frequencies and Bode plots in understanding their performance is emphasized.
Detailed
Analyzing Combined Transfer Function
In this section, we delve into the analysis of the frequency response of R-C and C-R circuits, building on previously discussed concepts. We begin by introducing the Laplace domain, where we substitute circuit components and derive the transfer functions for both circuits. The transformation from the Laplace domain to the Fourier domain is highlighted, allowing for a clearer understanding of how these circuits respond to varying frequencies.
Key Concepts Covered:
- Magnitude and Phase Response: The section details how the magnitude of the frequency response behaves at low and high frequencies, with points of transition governed by the parameters RC. The initial response at low frequencies approaches unity, while high frequencies exhibit attenuation, a phenomenon illustrated through hyperbolic responses.
- Corner Frequencies: The relationship between circuit poles and corner frequencies is crucial. We identify how the position of these poles determines the cut-off points in the frequency response—specifically how they influence the gain and phase shifts across different frequency ranges.
- Bode Plot Analysis: The frequency response characteristics are examined through Bode plots, emphasizing how logarithmic scales offer linearity in slope changes at corner frequencies. We discuss the different slopes corresponding to various sections of the frequency response and underscore how this aids in identifying high-pass and low-pass characteristics in combined circuits.
- Cascading Effects: Finally, the section talks about the effects of loading when cascading circuits, introducing voltage-dependent sources to minimize such impacts, thus ensuring a clear understanding of the entire system response.
This analysis not only solidifies the understanding of individual circuit behaviors but also emphasizes the importance of frequency response and stability in circuit design.
Youtube Videos

Audio Book
Dive deep into the subject with an immersive audiobook experience.
Understanding the Combined Circuit Setup
Chapter 1 of 4
🔒 Unlock Audio Chapter
Sign up and enroll to access the full audio experience
Chapter Content
To avoid the loading effect what we have done here it is we do have the C-R circuit we do have the C-R circuit and also we do have the R-C circuit. And, in between we are putting some ideal kind of block saying that this block it is what it is doing is that whatever the voltage it is getting developed called say V1 it produces a voltage here V2 which is equal to constant times this V1. So, I should say that this model this ideal model of this voltage dependent voltage source I should say this voltage dependent voltage source ensures that loading effect of this R-C circuit is not falling on this C-R circuit.
Detailed Explanation
In a combined circuit setup where an R-C circuit and a C-R circuit are utilized, one challenge that can arise is known as the loading effect. This occurs when components of circuits affect each other's performance. To mitigate this issue, a voltage-dependent voltage source is introduced between these two circuits. This source ensures that the output voltage from the first circuit (V1) is amplified and fed into the next circuit (V2) without causing interactions that would alter the circuits' intended behaviors. The amplifier acts as a buffer, allowing the circuits to function independently while still effectively transmitting signals.
Examples & Analogies
Think of this setup like a relay race where one runner represents the first circuit and the next runner represents the second circuit. If the first runner slows down due to fatigue (the loading effect), the second runner would start struggling to keep up with the race. To solve this, we can introduce a coach (the voltage-dependent voltage source) who helps the first runner maintain speed, ensuring that the second runner gets a consistent pace to run the race effectively.
Deriving the Overall Transfer Function
Chapter 2 of 4
🔒 Unlock Audio Chapter
Sign up and enroll to access the full audio experience
Chapter Content
From primary input to primary output transfer function if we try to see we can split this transfer function into three components one is coming from this C-R circuit, namely ... 1+ sCR. So, this is the first part this is coming from the C-R circuit and then the second part which is coming from the amplifier. So, we do have this amplifier here. ... overall the input to output transfer function what we are getting here it is ...
Detailed Explanation
To analyze the overall transfer function in the combined circuit setup, we dissect the entire circuit into three parts: (1) the C-R circuit transfer function, (2) the transfer function from the voltage amplifier, and (3) the R-C circuit transfer function. The first part encapsulates the behavior of the C-R circuit as governed by its resistance (R) and capacitance (C). The second component captures how the ideal amplifier modifies the input signal, amplifying it with a certain gain A. Finally, the third part describes how the R-C circuit manages the output. When combined, all these elements tell us how the entire system will behave in response to varying input frequencies. Ultimately, we derive an overall transfer function that hides numerous nuances of the individual components, offering a complete picture of the system's performance in a broader frequency context.
Examples & Analogies
Consider a restaurant where the meal preparation (C-R circuit), the kitchen staff (amplifier), and the dining experience (R-C circuit) need to come together. If the kitchen staff works inefficiently (like a poor amplifier), it affects the speed and quality of meal serving. By looking closely at each part—how meals are prepared, how the kitchen operates, and how the service is provided—we can understand how the whole restaurant operates. Combining these insights, we get a clearer picture of the dining experience, similar to analyzing the overall transfer function of the circuits.
Analyzing Frequency Response
Chapter 3 of 4
🔒 Unlock Audio Chapter
Sign up and enroll to access the full audio experience
Chapter Content
So, now let us see the; so, here we have considered R-C circuit which it was having a pole and we have seen the relationship to cutoff frequency. Let us look into the other circuit namely the C-R circuit which is having slightly different transfer function.
Detailed Explanation
When analyzing circuits like the R-C circuit and the C-R circuit, we often investigate their frequency responses—especially how they interact with different frequencies of input signals. Each circuit has a specific transfer function that reveals the behavior of voltage and current across different frequencies, with poles indicating critical cutoff frequencies that define the circuit's operation range. The R-C circuit primarily demonstrates low-pass behavior, allowing lower frequencies to pass through while filtering out higher ones. Conversely, the C-R circuit shows high-pass characteristics, emphasizing the passing of higher frequencies and attenuating lower ones. Understanding these functions helps engineers and designers optimize circuits for desired frequency responses.
Examples & Analogies
Think of the R-C circuit like a filter at a concert, letting through the deep thumping bass (low frequencies) while blocking out the shrill sounds of the higher frequency instruments. On the other hand, the C-R circuit is more like an air conditioner vent that focuses on pushing out the cooler air (higher frequencies) while letting stagnant or warmer air (lower frequencies) get trapped. Analyzing how these filters operate in their respective frequency ranges allows us to choose which circuit to use based on what kind of 'music' we want to let through.
Combining Circuit Responses
Chapter 4 of 4
🔒 Unlock Audio Chapter
Sign up and enroll to access the full audio experience
Chapter Content
So, whenever we will be talking about this frequency response what we are trying to capture it is the location of the corner frequency and that can be directly obtained from the pole of the transfer function in Laplace domain.
Detailed Explanation
In discussing frequency responses of electrical circuits, a crucial outcome is identifying the corner frequency which signifies the point at which a circuit transitions in its responsiveness to signals. This frequency is directly linked to the pole locations in the Laplace domain representation of the transfer function. Hence, engineers can predict how the circuit will behave over various input frequencies by examining these pole locations—either of the R-C or C-R circuits—or when they are combined, as was explained earlier. Understanding the implications of these poles and their relation to corner or cutoff frequencies empowers circuit design and helps in tuning electronic devices for optimum performance.
Examples & Analogies
In a sports arena for basketball, imagine the key area just around the net where players need to adapt quickly between higher or lower shots based on the defending team. This area is similar to the corner frequency; it's where the dynamics of the game can dramatically change. The players (the circuits) must recognize when to play defensively (low frequencies, filtering) or aggressively (high frequencies, amplifying), similar to how engineers adjust their components based on the position of the poles in their analysis.
Key Concepts
-
Magnitude and Phase Response: The section details how the magnitude of the frequency response behaves at low and high frequencies, with points of transition governed by the parameters RC. The initial response at low frequencies approaches unity, while high frequencies exhibit attenuation, a phenomenon illustrated through hyperbolic responses.
-
Corner Frequencies: The relationship between circuit poles and corner frequencies is crucial. We identify how the position of these poles determines the cut-off points in the frequency response—specifically how they influence the gain and phase shifts across different frequency ranges.
-
Bode Plot Analysis: The frequency response characteristics are examined through Bode plots, emphasizing how logarithmic scales offer linearity in slope changes at corner frequencies. We discuss the different slopes corresponding to various sections of the frequency response and underscore how this aids in identifying high-pass and low-pass characteristics in combined circuits.
-
Cascading Effects: Finally, the section talks about the effects of loading when cascading circuits, introducing voltage-dependent sources to minimize such impacts, thus ensuring a clear understanding of the entire system response.
-
-
This analysis not only solidifies the understanding of individual circuit behaviors but also emphasizes the importance of frequency response and stability in circuit design.
Examples & Applications
Example of an R-C circuit's transfer function expressed as H(s) = 1/(1+sRC), highlighting how it behaves at different frequencies.
A Bode plot showing the frequency response of a low-pass filter with a -3 dB cut-off point, illustrating the concept of gain drop.
Memory Aids
Interactive tools to help you remember key concepts
Rhymes
Transfer functions are neat, they show how inputs meet outputs sweet.
Acronyms
P.O.W.E.R. - Poles, Output, Waveform, Evaluate Response.
Stories
Imagine a circuit as a highway, where the transfer function is the speed limit sign—marking how fast signals can flow. The poles are tollbooths, slowing down the vehicles (signals) once crossed, ensuring smooth traffic ahead.
Memory Tools
To remember the characteristics of R-C circuits: 'Pace Your Phase' - starting with the magnitude at unity and tracking the phase shift downwards.
Flash Cards
Glossary
- Transfer Function
A mathematical representation of the relationship between the input and output of a circuit in the Laplace domain.
- Bode Plot
A graphical representation consisting of two plots (magnitude and phase) that help analyze the frequency response of circuits.
- Cutoff Frequency
The frequency at which the magnitude response of the circuit drops to -3 dB, indicating a significant change in signal behavior.
- Pole
A frequency value in the complex s-plane that causes the transfer function to become infinite and influences circuit behavior.
- Magnitude Response
The output of a circuit expressed as a function of its input, typically represented in decibels (dB) across frequencies.
- Phase Shift
The difference in phase between the input and output signals of a circuit as a function of frequency.
Reference links
Supplementary resources to enhance your learning experience.