
CALCULATION OF RANK CORRELATION
Enroll to start learning
You’ve not yet enrolled in this course. Please enroll for free to listen to audio lessons, classroom podcasts and take practice test.
Interactive Audio Lesson
Listen to a student-teacher conversation explaining the topic in a relatable way.
Introduction to Correlation
🔒 Unlock Audio Lesson
Sign up and enroll to listen to this audio lesson

Today, we will discuss correlation. Can anyone tell me what correlation means?

Is it a way to show how two things are related?
Absolutely! Correlation measures the relationship between two variables. We typically assess if one variable changes, does the other one also change? We use coefficients to quantify this relationship.

What kinds of relationships can we observe?
Good question! Relationships can be positive, negative, or even non-existent. This leads us into our main focus today: rank correlation, specifically Spearman's rank correlation coefficient.

When would we use rank correlation instead of something like Pearson's correlation?
Rank correlation is particularly useful when we can't accurately measure the data points but can rank them. It helps provide insights in those situations.

Can you give an example of where it might apply?
Certainly! In cases where we measure subjective qualities, like student performance based on grades or behavior ratings.
To summarize, correlation helps us understand relationships between variables, and rank correlation is particularly useful for ordinal data.
Spearman's Rank Correlation Coefficient
🔒 Unlock Audio Lesson
Sign up and enroll to listen to this audio lesson

Now let's discuss Spearman's rank correlation coefficient and how to calculate it. Who can remind us of the formula?
Is it $r_s = 1 - \frac{6 \sum D^2}{n(n^2 - 1)}$?
Exactly! This formula helps us find the correlation based on ranked data. 'D' represents the difference between ranks for each variable.
How do we assign ranks though?
Good point! For a set of data, we assign ranks starting from 1 for the smallest value. If there are ties, we give them the average rank. Can you all think of an example?
What if we have repeated values? Like two students who got the same score?
In this case, we assign them the average of the ranks that they would occupy. It's crucial for accurate results!
To recap: Spearman's rank correlation is calculated after assigning ranks and applying the formula for correlation coefficient. This provides insights into the relationship between ranked variables.
Application and Interpretation of Spearman's Rank
🔒 Unlock Audio Lesson
Sign up and enroll to listen to this audio lesson
Let's dive into applications of Spearman's rank correlation. Can someone give an example of data sets we might compare?
Maybe like the heights and weights of students?
Exactly! When we rank heights and weights, we can analyze the correlation and deduce if taller students generally weigh more.
What if our 'r' value is really high?
A high 'r' value close to +1 indicates a strong positive correlation, while values close to -1 reflect a strong negative correlation. An 'r' of 0 indicates no correlation.
So if we found an 'r' of -0.9 between time spent studying and exam performance, what does that mean?
That would suggest a strong inverse relationship – the more time spent studying, the lower the scores. Let’s remember that correlation doesn’t imply causation; other factors could influence this.
In summary, we can analyze relationships in ranked data using Spearman's rank correlation, interpreting the strength and direction of associations carefully.
Introduction & Overview
Read summaries of the section's main ideas at different levels of detail.
Quick Overview
Standard
In this section, the calculation of rank correlation is introduced, focusing on Spearman's rank correlation coefficient. It highlights the differences between this and Pearson's correlation, discusses its applications, and explains how to compute rank correlations with examples. The section also emphasizes the interpretive nature of correlation and the importance of understanding underlying data quality.
Detailed
Calculation of Rank Correlation
This section delves into rank correlation, especially focusing on Spearman’s rank correlation coefficient, which offers a method to analyze the relationship between two variables, particularly useful when the data points cannot be accurately measured or are in ordinal form.
Key Highlights:
- Understanding Rank Correlation: Rank correlation assesses how well the relationship between two variables can be described by a monotonic function. Spearman's coefficient can interpret ranked data, providing insights into connection strength.
- When to Use Spearman's Rank Coefficient: It is typically used when the variables are not suitable for Pearson's correlation due to non-normal distributions, outlier presence, or ordinal data. It prioritizes the order of data instead of the precise values.
-
Calculation Steps:
- Assign ranks to the data entries.
- Calculate the differences between ranks for each pair of values.
- Input these differences into the Spearman's formula:
-
Interpreting Correlation Coefficients:
- A coefficient of +1 indicates a perfect positive correlation.
- A coefficient of -1 indicates a perfect negative correlation.
- A value of 0 implies no correlation.
- Example Calculations: The section provides clear examples throughout, illustrating how to compute Spearmen's coefficient and discussing the implications of the correlation results.
Understanding rank correlation assists in effectively analyzing data relationships in varied contexts, especially when direct numerical measurements are unreliable.
Youtube Videos


Audio Book
Dive deep into the subject with an immersive audiobook experience.
Introduction to Rank Correlation
Chapter 1 of 5
🔒 Unlock Audio Chapter
Sign up and enroll to access the full audio experience
Chapter Content
The calculation of rank correlation will be illustrated under three situations:
1. The ranks are given.
2. The ranks are not given. They have to be worked out from the data.
3. Ranks are repeated.
Detailed Explanation
Rank correlation measures the relationship between the rankings of items rather than their raw scores. It can be calculated in three scenarios: when ranks are given, when they need to be figured out from data, and when students or items have the same rank.
Examples & Analogies
Imagine a beauty contest where judges give scores to contestants. Instead of looking at the absolute scores, we compare their rankings to see how similarly the judges ranked the contestants.
When Ranks Are Given
Chapter 2 of 5
🔒 Unlock Audio Chapter
Sign up and enroll to access the full audio experience
Chapter Content
The rank correlation between A and B is calculated as follows:
A C D D²
1 1 0 0
2 3 –1 1
3 5 –2 4
4 2 2 4
5 4 1 1
Total 10
Substituting these values in formula (4) the rank correlation is 0.5.
Detailed Explanation
When ranks are provided, calculating rank correlation becomes straightforward. You find the differences between the ranks of two variables, square these differences, and plug them into a specific formula. The closer result approaches 1, the more similar the judges' rankings are.
Examples & Analogies
Continuing with the beauty contest, if one judge’s rankings perfectly matched those of another, the rank correlation would be 1. If they ranked completely oppositely, it would be -1.
When Ranks Are Not Given
Chapter 3 of 5
🔒 Unlock Audio Chapter
Sign up and enroll to access the full audio experience
Chapter Content
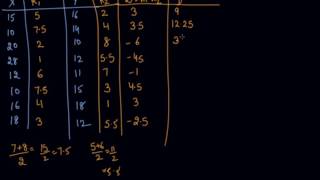
The rank correlation between A and B can be calculated from the percentage of marks secured by 5 students in Economics and Statistics. Then the ranking has to be worked out and the rank correlation is to be calculated.
Detailed Explanation
In situations where raw scores are provided but not ranks, the first step is to rank the scores. After establishing the ranks, you can follow the same procedures for calculating rank correlation as if the ranks were given.
Examples & Analogies
Think about students' exam scores in two subjects. First, you list their scores in order for each subject, rank them, and then compare these ranks to understand the correlation.
When Ranks Are Repeated
Chapter 4 of 5
🔒 Unlock Audio Chapter
Sign up and enroll to access the full audio experience
Chapter Content
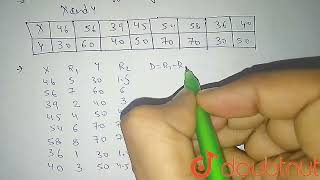
The formula of Spearman’s rank correlation coefficient when the ranks are repeated is:
r = 1−
s
6ΣD²/(n³ - n)
where n is the number of observations and D the deviation of ranks assigned to a variable from those assigned to the other variable.
Detailed Explanation
In cases where some items share the same rank (for example, two students scored equally), we assign them the average rank. This method accounts for ties in ranks, ensuring a fair correlation evaluation.
Examples & Analogies
Imagine a race where two runners finish at the same time. Instead of assigning them separate ranks, we assign them a combined average rank to maintain fairness and accuracy in comparison.
Conclusion on Rank Correlation
Chapter 5 of 5
🔒 Unlock Audio Chapter
Sign up and enroll to access the full audio experience
Chapter Content
We have discussed some techniques for studying the relationship between two variables, particularly the linear relationship. The scatter diagram gives a visual presentation of the relationship between two variables. Karl Pearson’s coefficient of correlation r measures numerically only linear relationships between two variables. r lies between –1 and 1.
Detailed Explanation
Rank correlation focuses on the order of items rather than their values. Different techniques allow for evaluating linear relationships, thus providing insights into how two sets of data move together.
Examples & Analogies
For instance, businesses might use rank correlation to compare customer satisfaction with product quality. If higher quality leads regularly to better satisfaction rankings, that correlation can guide improvements.
Key Concepts
-
Correlation: A measure of the relationship between two variables.
-
Spearman's Rank Correlation: A method for calculating correlation for ranked data.
-
Coefficient of Correlation: A numerical representation of the strength and direction of the relationship.
Examples & Applications
Example 1: Suppose we want to examine the relationship between the amount of time spent studying and grades. By comparing ranks, we might find a coefficient of -0.85, indicating a strong negative correlation.
Example 2: Analyzing the relationship between years of education and income can show a strong positive correlation, indicated by a coefficient of +0.75, suggesting that higher education generally leads to higher income.
Memory Aids
Interactive tools to help you remember key concepts
Rhymes
When numbers don't get along, rank them right or you'll go wrong!
Stories
Imagine a class where students got ranked by height; tall students tend to score higher in sports too. By ranking their heights and sports scores, you discover they are closely linked!
Memory Tools
RANK: R for Ranks, A for Assign to data, N for Numbers compared, K for Known correlation.
Acronyms
SPEARMAN
Strong Positive Either Up or Reverse Can Assess Monotonous Attributes and Numbers.
Flash Cards
Glossary
- Correlation
A statistical measure that expresses the extent to which two variables are linearly related.
- Spearman’s Rank Correlation
A non-parametric measure of rank correlation that assesses how well the relationship between two variables can be described by a monotonic function.
- Ranks
The assigned order of data points based on their values; used when raw numerical measurements are unavailable.
- Coefficient
A numerical value representing the degree of correlation; ranges from -1 to +1.
Reference links
Supplementary resources to enhance your learning experience.