
Karl Pearson’s Coefficient of Correlation
Enroll to start learning
You’ve not yet enrolled in this course. Please enroll for free to listen to audio lessons, classroom podcasts and take practice test.
Interactive Audio Lesson
Listen to a student-teacher conversation explaining the topic in a relatable way.
Understanding Correlation
🔒 Unlock Audio Lesson
Sign up and enroll to listen to this audio lesson

Good morning, everyone! Today, we're diving into the concept of correlation. Correlation measures the relationship between two variables. Can anyone tell me why understanding correlation is important?

It helps us see if, and how, two things are related!

Like if sales increase when marketing spends more money?
Exactly! But remember, correlation doesn't mean causation. Just because two variables correlate doesn't mean one causes the other. Think of it as a dance; they move together, but one isn’t leading the other necessarily.

So, it's like ice cream sales rising with the warm weather, but not because ice cream makes it warm?
Great example! That's right. Instead, temperature is the underlying factor. Let's remember this: 'Correlate does not mean create!'
To wrap up, correlation helps us identify relationships instead of causing them, and can highlight areas for further investigation.
Types of Correlation
🔒 Unlock Audio Lesson
Sign up and enroll to listen to this audio lesson

Now, let’s look at the types of correlation—positive and negative. When we say a relationship is positive, what do we mean?

Both variables increase together!
Exactly! For example, higher incomes often lead to higher consumption. And what about negative correlation?
That's when one variable increases, and the other decreases, right?
You got it! Like how an increase in supply of a product can lead to a decrease in its price. Remember the acronym PAND—Positive And Negative Direction!
That's an easy way to remember it!
Great! To sum it up, recognizing the types of correlation helps us predict how one factor may influence another. Remember, PAND!
Scatter Diagrams
🔒 Unlock Audio Lesson
Sign up and enroll to listen to this audio lesson
Let’s take a look at scatter diagrams. Has anyone seen one before?
Yes! They plot data points to show relationships, right?
Exactly! Scatter diagrams show you how closely two variables are related visually. If points cluster around a line, it indicates a strong correlation. Can anyone describe how you can interpret a scatter diagram?
More points on the upward slope mean a positive correlation, while downward means there's a negative correlation.
Well done! Just remember: tighter grouping indicates stronger correlations, while scattered points indicate weaker correlations. Think of the phrase SCATTER—Strong Clustering, A Tight Trend Revealing!
That’s a handy reminder!
To summarize, scatter diagrams provide insightful visual depictions of correlation strength and direction. Keep SCATTER in mind!
Calculating Pearson's Correlation Coefficient
🔒 Unlock Audio Lesson
Sign up and enroll to listen to this audio lesson
Now, let’s get into calculating Pearson's Coefficient. Who knows the formula?
It’s something like... covariance over standard deviations...?
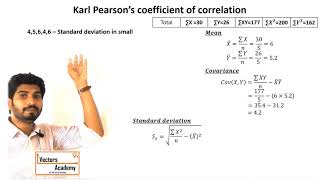
You're on the right track! The formula is: \[ r = \frac{Cov(X,Y)}{\sigma_X \sigma_Y} \]. Here, Cov(X,Y) is the covariance, while σ is the standard deviation.
So, it's like standardizing the covariance?
Exactly! This helps in comparing the degree of correlation regardless of the scale of measurement. Use the mnemonic 'RCS' – 'Ratio of Covariance to Standard deviations!'
That's clear! So what does it mean if r is close to 1 or -1?
Good question! If r is close to 1 or -1, it indicates a perfect positive or negative correlation, respectively. If it’s around 0, there’s little to no correlation. Keep RCS in mind for calculations!
Spearman’s Rank Correlation
🔒 Unlock Audio Lesson
Sign up and enroll to listen to this audio lesson
Lastly, let’s discuss Spearman's Rank Correlation. When is this more appropriate than Pearson's?
When data isn’t exactly measurable, like with emotions or qualities?
Yes! Spearman’s correlation uses ranks instead of actual values, making it good for non-parametric data. Remember the phrase RANK—Ranks Assess Non-parametric Knowledge!
So it’s more flexible!
Exactly! It can provide insights into relationships when standard measures fail. Remember RANK!
Introduction & Overview
Read summaries of the section's main ideas at different levels of detail.
Quick Overview
Standard
This section covers the concept of correlation, focusing on the calculation and significance of Karl Pearson’s Coefficient of Correlation. It discusses types of relationships, how to interpret correlation coefficients, scatter diagrams, and introduces Spearman’s rank correlation as an alternative approach.
Detailed
Detailed Summary of Karl Pearson’s Coefficient of Correlation
This section delves into correlation analysis, which serves as a systematic method for examining relationships between two variables. It introduces Karl Pearson’s Coefficient of Correlation, which is a measure used to quantify the degree to which two variables change together and to find out whether such changes have a specific direction (positive or negative).
Understanding Correlation
Correlation can represent various relationships, yet it doesn't imply causation—meaning that just because two variables correlate, one does not necessarily cause the other. For instance, the increase in ice cream sales and a rise in drowning incidents correlate with increased temperatures; however, this does not imply that one causes the other.
Types of Correlation
Correlation can be categorized into two types:
1. Positive Correlation: As one variable increases, the other variable also increases.
2. Negative Correlation: As one variable increases, the other decreases.
Measurement Tools
Three primary tools are used for studying correlation:
- Scatter Diagrams: Visual representations that plot the values of two variables. These help in observing the relationship type and strength.
- Karl Pearson’s Coefficient of Correlation (r): A numerical value ranging from -1 to 1 that indicates the strength and direction of a linear relationship.
- Spearman’s Rank Correlation: A non-parametric measure used when variables cannot be measured precisely.
Calculating the Coefficient
The formula for calculating Pearson's coefficient involves:
- The covariance of X and Y.
- The standard deviations of X and Y.
The values yield insights into how closely the two variables are related and how they relate in terms of direction.
Conclusion
In summary, correlation analysis is crucial for understanding the nature of relationships between variables in social sciences, economics, etc. Courses or educational subjects require caution since correlation does not imply causation and should be interpreted within the context of the data involved.
Youtube Videos


Audio Book
Dive deep into the subject with an immersive audiobook experience.
Understanding Correlation Analysis
Chapter 1 of 6
🔒 Unlock Audio Chapter
Sign up and enroll to access the full audio experience
Chapter Content
Correlation studies and measures the direction and intensity of relationship among variables.
Detailed Explanation
Correlation analysis helps us understand how two variables are related. It can tell us if an increase in one variable leads to an increase or decrease in another variable. In essence, correlation quantifies the relationship between two sets of data, capturing both the direction (positive or negative) and the strength of the relationship.
Examples & Analogies
For example, think of a relationship between hours studied and exam scores. If students who study more hours generally score higher on exams, there is a positive correlation between hours studied and exam scores.
Types of Relationship
Chapter 2 of 6
🔒 Unlock Audio Chapter
Sign up and enroll to access the full audio experience
Chapter Content
Correlation is commonly classified into negative and positive correlation. The correlation is said to be positive when the variables move together in the same direction.
Detailed Explanation
When we say there is a positive correlation, we mean that as one variable increases, the other variable also increases. Conversely, a negative correlation occurs when one variable increases while the other decreases. This classification helps in understanding the nature of relationships in different contexts.
Examples & Analogies
Think of the relationship between temperature and ice cream sales. On hot days, ice cream sales go up (positive correlation), while on cold days, sales tend to go down (negative correlation).
Scatter Diagrams
Chapter 3 of 6
🔒 Unlock Audio Chapter
Sign up and enroll to access the full audio experience
Chapter Content
A scatter diagram visually presents the nature of association without giving any specific numerical value.
Detailed Explanation
A scatter diagram is a graph that shows points plotted according to the values of two variables. By looking at how the points are arranged, we get a visual indication of the type of relationship between the variables. If the points cluster around an upward slope, there is a positive correlation; if they cluster around a downward slope, there is a negative correlation.
Examples & Analogies
Imagine you are plotting the time spent studying against scores obtained in tests for a class. If you see a lot of points that trend upwards to the right, it suggests that more study time is associated with higher scores.
Karl Pearson’s Coefficient of Correlation
Chapter 4 of 6
🔒 Unlock Audio Chapter
Sign up and enroll to access the full audio experience
Chapter Content
This is also known as product moment correlation coefficient or simple correlation coefficient.
Detailed Explanation
Karl Pearson’s coefficient of correlation (r) is a numerical measure that quantifies the degree of linear relationship between two variables. It can take values between -1 and 1, where 1 means a perfect positive correlation, -1 means a perfect negative correlation, and 0 indicates no linear correlation.
Examples & Analogies
If you measure the height and weight of people and find a value of r close to 1, it means taller individuals tend to weigh more. If r is close to -1, it indicates that as one variable increases, the other decreases consistently.
Properties of the Correlation Coefficient
Chapter 5 of 6
🔒 Unlock Audio Chapter
Sign up and enroll to access the full audio experience
Chapter Content
Let us now discuss the properties of the correlation coefficient.
Detailed Explanation
The correlation coefficient is a dimensionless quantity (it doesn't have units), which makes it useful for comparing the strength of relationships across different contexts. A value of r close to 0 indicates a weak relationship, while values close to 1 or -1 indicate a strong relationship. Additionally, it’s important to remember that correlation does not imply causation; two variables can be correlated without one causing the other.
Examples & Analogies
For instance, there may be a correlation between the number of people buying ice cream and an increase in park visits during summer. While both might rise together, it doesn't mean buying ice cream causes more park visits.
Applications of Correlation Coefficient
Chapter 6 of 6
🔒 Unlock Audio Chapter
Sign up and enroll to access the full audio experience
Chapter Content
The correlation coefficient can be used in various fields including economics, psychology, and health studies.
Detailed Explanation
In practical applications, the correlation coefficient helps researchers and analysts determine relationships between variables. For instance, businesses might analyze the correlation between advertisement spending and sales to assess the effectiveness of their advertising strategies.
Examples & Analogies
Consider a farmer who wants to know if there is a relationship between the quantity of fertilizer used and the yield of crops. By calculating the correlation coefficient, the farmer can better understand how fertilizer usage affects crop yield and make more informed decisions on resource allocation.
Key Concepts
-
Correlation: Measures the relationship between two variables.
-
Causation: Implies that one variable affects another.
-
Pearson's Coefficient: Quantifies the linear relationship between two variables.
-
Negative Correlation: One variable increases while the other decreases.
-
Positive Correlation: Both variables increase together.
-
Spearman's Rank: A method for correlation using ranked data.
Examples & Applications
An example of positive correlation is the relationship between height and weight, where as height increases, weight tends to increase as well.
Negative correlation can be exemplified through the relationship between the price of a product and its demand; as the price increases, demand typically decreases.
Memory Aids
Interactive tools to help you remember key concepts
Rhymes
If they dance in sync, that's a sign, a positive link, they shine and align!
Stories
Imagine a sunny day, Ice-creams and swims, together they play. As the heat climbs, their sales too fly, but drowning isn't the ice cream's high.
Memory Tools
Remember 'PAND' for Positive And Negative Direction in correlation!
Acronyms
Use 'RCS' for Understanding the Ratio of Covariance to Standard deviations when calculating correlation!
Flash Cards
Glossary
- Correlation
A statistical measure that describes the extent to which two variables change together.
- Causation
A relationship between variables where one variable directly affects the other.
- Karl Pearson's Coefficient of Correlation
A numerical measure ranging between -1 and 1 that indicates the strength and direction of a linear relationship.
- Covariance
A measure of how much two random variables vary together.
- Spearman's Rank Correlation
A non-parametric measure of correlation that assesses the strength and direction of association between two ranked variables.
- Scatter Diagram
A graphical representation that plots data points to show the relationship between two variables visually.
Reference links
Supplementary resources to enhance your learning experience.