
Step Deviation Method
Enroll to start learning
You’ve not yet enrolled in this course. Please enroll for free to listen to audio lessons, classroom podcasts and take practice test.
Interactive Audio Lesson
Listen to a student-teacher conversation explaining the topic in a relatable way.
Introduction to Correlation Coefficient
🔒 Unlock Audio Lesson
Sign up and enroll to listen to this audio lesson

Today, we’ll discuss the correlation coefficient and why it's important in statistics. Can anyone tell me what correlation means?

Isn't it about how two variables relate to each other?
Exactly! Correlation measures the relationship between two variables. It can indicate whether they move in the same direction or opposite directions. Do you remember how we categorize these relationships?

Positive and negative correlation?
Great! Positive correlation means they move together, while negative means they move in opposite directions. Now, what about the correlation coefficient? What does it represent?

It gives a numeric value between -1 and 1 to show the strength and direction of the relationship.
Exactly! Remember this: a value close to +1 or -1 indicates a strong relationship, while values near 0 suggest no correlation.

How does the Step Deviation Method help in this?
Great question! The Step Deviation Method simplifies calculations, especially with larger values. We’ll dive into how that works in later sessions.
So to summarize, correlation is crucial for understanding relationships between variables, and the coefficient helps quantify this relationship.
Step Deviation Method Explained
🔒 Unlock Audio Lesson
Sign up and enroll to listen to this audio lesson

Now, let’s discuss the Step Deviation Method. This method involves transforming our variables, X and Y, into more manageable forms. Can anyone identify what kind of transformation we might do?
Do we use the mean?
Exactly! We subtract the mean from the values. For example, if A is our assumed mean for X, what do we get?
X minus A, right?
Correct! This results in U = (X - A) / B, where B is our common factor. Now why do we do this?
To make the calculations easier?
Exactly! We need to ensure we’re prepared to handle large datasets without overwhelming complexity. Let’s look at how all of this translates into calculating the correlation coefficient.
How do the transformations affect the coefficients?
Excellent point! The transformations allow us to apply a unified approach for correlation values while keeping their properties intact, making it easier to calculate.
In summary, the Step Deviation Method provides a streamlined process to compute correlation coefficients by transforming our data.
Applying the Step Deviation Method
🔒 Unlock Audio Lesson
Sign up and enroll to listen to this audio lesson
Let’s apply what we’ve learned! We’ll calculate a correlation coefficient using the Step Deviation Method. Can anyone tell me what values we need?
We need the sums of XY and the squares of X and Y for the calculations!
Right! By collecting the proper data, we can substitute them into our formulas. We’ll use the correlation coefficient formula we discussed earlier. Let's go through an example together.
Can you remind us of the formula?
Certainly! It's r = (ΣXY - (ΣX)(ΣY) / N) / sqrt((ΣX² - (ΣX)²/N)(ΣY² - (ΣY)²/N)). What’s important here is understanding how the Step Deviation Method allows us to simplify those calculations.
So we can transform values before calculating?
Exactly! By transforming our variables into U and V, we keep calculations straightforward. Let's go ahead and compute the correlation based on our example data.
I see how that reduces the load!
In summary, applying the Step Deviation Method conveniently allows for manageable calculations with correlation coefficients.
Introduction & Overview
Read summaries of the section's main ideas at different levels of detail.
Quick Overview
Standard
The Step Deviation Method allows for easier computation of correlation coefficients by transforming variables to simplify the calculations. It emphasizes that correlation measures the strength and direction of relationships between variables without suggesting causation. The method involves using standard values and averaging to reduce computational complexity, paving the way for accurate analysis of data relationships.
Detailed
Step Deviation Method
The Step Deviation Method is a technique used in statistics to calculate correlation coefficients more efficiently, especially when dealing with large numeric values. It facilitates the transformation of the variables involved (X and Y) into standardized forms before computation, thereby eliminating cumbersome calculations through direct substitution. Rather than directly using the original values, this method applies a transformation—where mean values and common factors are introduced—thus significantly reducing the burden of calculation. This approach affirms the nature of correlation coefficients, which range between -1 and +1, indicating the strength and direction of relationships among variables. It is crucial to remember that correlations measured via this method do not imply causation between the variables.
The core concepts covered include how to set up the transformation variables, the correlation coefficient formula, and practical examples illustrating the method's application. The correlation between two variables may be impacted by other factors, so while this method provides an efficient means of calculation, critical thinking regarding data interpretation is essential.
Youtube Videos


Audio Book
Dive deep into the subject with an immersive audiobook experience.
Understanding the Step Deviation Method
Chapter 1 of 4
🔒 Unlock Audio Chapter
Sign up and enroll to access the full audio experience
Chapter Content
The correlation coefficient between marks secured in English and Statistics is, say, 0.1. It means that though the marks secured in the two subjects are positively correlated, the strength of the relationship is weak.
Detailed Explanation
The Step Deviation Method is a statistical technique used to simplify the calculation of the correlation coefficient, especially when working with large values. By transforming the variables into smaller, more manageable numbers, it reduces the calculation burden while still providing accurate correlation results. This method leverages the property of the correlation coefficient that it is independent of changes in origin and scale, allowing for these transformations.
Examples & Analogies
Imagine you are that student trying to compare your scores in two subjects but the raw scores are very high (say, 90s and 100s). Instead of dealing with these large numbers directly, you might decide to convert them into their deviations from a mean (like turning them into how many points above the average they are). This makes it much easier to see patterns and relationships between the two subjects!
Establishing Relationships Between Transformed Variables
Chapter 2 of 4
🔒 Unlock Audio Chapter
Sign up and enroll to access the full audio experience
Chapter Content
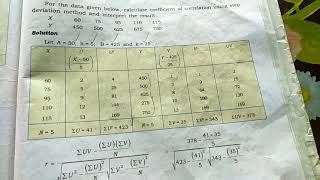
To illustrate, let A = 100; h = 10; B = 1700 and k = 100. The table of transformed variables is created.
Detailed Explanation
In the Step Deviation Method, we choose constants A, B (means of variables) and constants h, k (common scaling factors) to transform our variables into smaller numbers. For example, if we have a variable X measuring price that ranges between 100 and 200. By setting A to 100 and choosing h as 10, we can transform each value of X into a new variable U that is easier to handle. This transformation reduces the complexity of the calculations needed to find the correlation coefficient.
Examples & Analogies
Think of it like using a smaller scale to measure a large object. If a ruler measures things in centimeters from 0 to 100, but you have an object that’s 500 cm long, you can mark the object in a way that every 10 cm equals 1 unit on your ruler. This way, you get manageable numbers to work with while still being able to calculate the full length accurately!
Calculating the Correlation Coefficient
Chapter 3 of 4
🔒 Unlock Audio Chapter
Sign up and enroll to access the full audio experience
Chapter Content
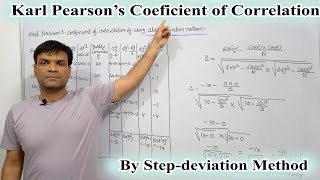
Substituting these values in the formula (3).
Detailed Explanation
Once the values are transformed using the Step Deviation Method, you substitute them into the formula for correlation coefficient. This enables a straightforward computation that gives a precise numerical value reflecting the strength and direction of the relationship between the variables. The values calculated will illustrate how closely related the two sets of data are after the transformation.
Examples & Analogies
It’s like finding out how much money two friends spend on snacks. If one person spends $15 and another spends $25, you could transform these numbers to find out the range of their spending against an average budget, making the comparison easier. Instead of just seeing raw expenses, you'd see a clear pattern of spending behavior!
Significance of Correlation Values
Chapter 4 of 4
🔒 Unlock Audio Chapter
Sign up and enroll to access the full audio experience
Chapter Content
If the correlation coefficient is 0.1, it indicates a weak positive correlation, while a value close to 1 or -1 indicates a strong correlation in either direction.
Detailed Explanation
Interpreting correlation coefficients involves understanding that a value close to 1 indicates a strong positive relationship, meaning that as one variable increases, the other does too. Conversely, a value near -1 indicates a strong negative correlation, where one variable increases while the other decreases. A value around 0 suggests little to no linear relationship. These interpretations help researchers and statisticians understand data relationships effectively.
Examples & Analogies
Imagine tracking the number of hours you study and your scores on tests. If you find a high correlation (close to 1), it means longer study hours typically lead to higher test scores. If the correlation was 0.1, it suggests that studying more may not significantly impact your test scores, leading you to reconsider how you approach your study habits!
Key Concepts
-
Correlation: A measure of the relationship between two variables.
-
Correlation Coefficient: Quantifies the strength and direction of a relationship.
-
Step Deviation Method: A technique to simplify correlation calculations.
-
Positive and Negative Correlation: Describes the nature of variable relationships.
Examples & Applications
Example of positive correlation: Height and weight of individuals generally display a positive correlation; as height increases, weight tends to increase.
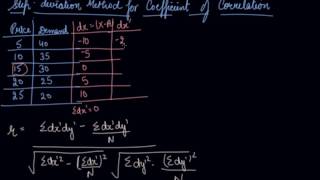
Example of negative correlation: The price of goods typically shows a negative correlation with their demand; as prices increase, demand usually decreases.
Memory Aids
Interactive tools to help you remember key concepts
Rhymes
For positive trends, the numbers rise, As one increases, see the prize.
Stories
Imagine two friends walking in the park; when one speeds up, the other does too, just like positive correlation shows.
Memory Tools
To remember steps, think 'Calculate-Transform-Apply': C for Calculate means gathering data, T for Transform means adjusting numbers, A for Apply means using the formula.
Acronyms
Use 'CATS' to remember Steps for calculating correlation
Collect data
Adjust values
Transform variables
Substitute in formula.
Flash Cards
Glossary
- Correlation Coefficient
A numerical measure that represents the strength and direction of the relationship between two variables.
- Step Deviation Method
A technique for simplifying the calculation of correlation coefficients by transforming variables to reduce computational complexity.
- Positive Correlation
A relationship where both variables increase or decrease together.
- Negative Correlation
A relationship where one variable increases while the other decreases.
- Mean
The average value of a set of numbers, calculated by dividing the sum of the values by their count.
Reference links
Supplementary resources to enhance your learning experience.