
PROPERTIES OF CORRELATION COEFFICIENT
Enroll to start learning
You’ve not yet enrolled in this course. Please enroll for free to listen to audio lessons, classroom podcasts and take practice test.
Interactive Audio Lesson
Listen to a student-teacher conversation explaining the topic in a relatable way.
Understanding Correlation
🔒 Unlock Audio Lesson
Sign up and enroll to listen to this audio lesson

Today's topic is correlation. It simply means a relationship between two variables where one might affect the other. Can someone give me an example of correlation from everyday life?

How about the relationship between study hours and exam scores?
Exactly! When study hours increase, exam scores generally improve, suggesting a positive correlation. Remember, correlation doesn’t imply causation, so it’s essential to analyze further.

What if two things are correlated but don't affect each other?
Great question! That's called spurious correlation, like ice-cream sales and drowning rates, both rising in summer but not affecting each other.
So let's summarize that correlation shows relationships but doesn’t confirm that one causes the other.
Types of Correlation
🔒 Unlock Audio Lesson
Sign up and enroll to listen to this audio lesson

Now let’s explore types of correlation! Can anyone tell me what positive correlation means?

It’s when both variables move in the same direction!
Correct! And what’s negative correlation?

That's when one variable goes up while the other goes down.
Right again! Like the correlation between the price of apples and their demand. And what about no correlation?
That means there's no apparent relationship—it's like height and intelligence!
Exactly! In summary, positive and negative correlation helps us understand relationships, while no correlation tells us there’s no link at all.
Correlation Coefficient
🔒 Unlock Audio Lesson
Sign up and enroll to listen to this audio lesson
Let's dive into the correlation coefficient defined as 'r'. The formula helps determine the strength and direction of a relationship. Can anyone tell me the range of r?
It ranges between minus one and one!
Spot on! Now, very importantly, if r equals 1 or -1, what does that mean?
That shows perfect correlation!
Correct! On the other hand, if it equals 0...
There’s no correlation at all?
Yes! It's crucial to interpret these values carefully to understand and communicate data correctly.
Applications of Correlation
🔒 Unlock Audio Lesson
Sign up and enroll to listen to this audio lesson
So how can we apply what we've learned about correlation? Can one of you think of a scenario where this might be important?
In economics, to understand consumer behavior with prices!
Exactly! Analyzing how price changes affect demand is key to business decisions. What’s one more example?
Public health! Tracking correlations between lifestyle and health outcomes.
Absolutely! Remember, application helps us understand trends, but we still need to prove causality through research.
To summarize, using correlation in various fields helps us derive insights, yet it’s vital to understand its limitations.
Final Recap
🔒 Unlock Audio Lesson
Sign up and enroll to listen to this audio lesson
Now, let’s recap our discussion on correlation. What is the definition of correlation again?
It is a measure of the relationship between two variables.
Right! Name the two types of correlation.
Positive and negative, and no correlation!
Well done! And the correlation coefficient 'r' tells us what?
The strength and the direction of the relationship!
Absolutely! Remember these foundational concepts; they are very useful in data analysis. Great job today, everyone!
Introduction & Overview
Read summaries of the section's main ideas at different levels of detail.
Quick Overview
Standard
The section explores the correlation coefficient's significance, its range, and various properties. It clarifies that correlation does not imply causation and distinguishes between different types of correlations, including positive, negative, and no correlation.
Detailed
Detailed Summary
The section on Properties of Correlation Coefficient delves into how the correlation coefficient serves as a standardized measure to evaluate the relationship between two variables. The key points include:
- Definition and Interpretation: The correlation coefficient, denoted as 'r', ranges from -1 to 1, where -1 indicates perfect negative correlation, 1 indicates perfect positive correlation, and 0 indicates no correlation.
- Property Characteristics: The section outlines several important properties of the correlation coefficient:
- It is a unitless measure, meaning it does not depend on the units of measurement used for the variables.
- A positive value indicates both variables move in the same direction, whereas a negative value indicates an inverse relationship.
- Correlation does not imply causation; therefore, alternative explanations for the relationship should always be considered.
- The correlation coefficient remains unchanged with alterations to the scale or origin of the data.
- Correlation analysis primarily considers linear relationships, although non-linear relationships can exist.
- A high correlation indicates strength while a low correlation suggests a weak relationship, but this may still hide non-linear associations.
- Techniques for Calculation: The section also explains methods to visualize relationships through scatter diagrams and numeric measures via formulas such as Karl Pearson’s Coefficient.
By understanding these properties, learners can better analyze and interpret data relationships.
Youtube Videos


Audio Book
Dive deep into the subject with an immersive audiobook experience.
Definition and Units of Correlation Coefficient
Chapter 1 of 8
🔒 Unlock Audio Chapter
Sign up and enroll to access the full audio experience
Chapter Content
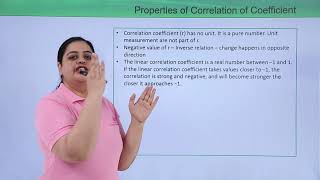
• r has no unit. It is a pure number. It means units of measurement are not part of r. r between height in feet and weight in kilograms, for instance, could be say 0.7.
Detailed Explanation
The correlation coefficient, represented as 'r', is a statistical measure that describes the strength and direction of a relationship between two variables. Importantly, 'r' does not have any associated units of measurement. This standardization makes it easier to compare correlation coefficients across different pairs of variables, regardless of how those variables are measured. For example, whether you're measuring height in feet or weight in kilograms, a correlation coefficient of 0.7 indicates a similar strength of association between the two variables.
Examples & Analogies
Imagine you are comparing the relationship between the number of hours students study and their grades. When you express both variables in different units (like hours for study and percentages for grades), the correlation remains valid and does not depend on the measurement units, making the results universally understandable.
Direction of Correlation
Chapter 2 of 8
🔒 Unlock Audio Chapter
Sign up and enroll to access the full audio experience
Chapter Content
• A negative value of r indicates an inverse relation. A change in one variable is associated with change in the other variable in the opposite direction. When price of a commodity rises, its demand falls. When the rate of interest rises the demand for funds also falls.
Detailed Explanation
A negative correlation coefficient (r < 0) implies that as one variable increases, the other decreases. This inverse relationship can be seen in various economic situations. For instance, if the price of a product increases, typically the quantity demanded decreases, resulting in a negative correlation between price and demand. This principle is fundamental in economics and helps anticipate how changes in price may affect consumer behavior.
Examples & Analogies
Think about the relationship between the prices of seasonal fruits. If the price of a fruit rises significantly, people might choose to buy less of it or opt for alternatives. Therefore, we see an inverse correlation – as the price climbs, the demand usually diminishes.
Positive Correlation
Chapter 3 of 8
🔒 Unlock Audio Chapter
Sign up and enroll to access the full audio experience
Chapter Content
• If r is positive the two variables move in the same direction. For instance, when the price of coffee rises, the demand for tea also rises.
Detailed Explanation
A positive correlation coefficient (r > 0) indicates a direct relationship where both variables change in the same direction. For example, if people start to prefer a particular drink (like tea) when the price of coffee increases, the correlation between the price of coffee and tea demand would be positive.
Examples & Analogies
Consider the relationship between exercise and physical fitness. As individuals exercise more (first variable), their fitness level typically increases (second variable). Their correlation would be positive, demonstrating that both variables are enhancing concurrently.
Perfect Correlation
Chapter 4 of 8
🔒 Unlock Audio Chapter
Sign up and enroll to access the full audio experience
Chapter Content
• If r = 1 or r = –1 the correlation is perfect and there is exact linear relation.
Detailed Explanation
Perfect correlation occurs when the correlation coefficient equals 1 or -1, indicating a flawless linear relationship. An r value of 1 shows that as one variable increases, the other increases proportionally, while an r value of -1 indicates that one variable decreases proportionally as the other increases. These cases represent two extremes of predicting one variable from another.
Examples & Analogies
An example of perfect correlation could be found in simple arithmetic: if you have one full cup of coffee and for every cup you add, you drain exactly one cup from another pot. The correlation between coffee consumed and coffee remaining would be perfect, showing the direct dependency between both variables.
Magnitude of Correlation
Chapter 5 of 8
🔒 Unlock Audio Chapter
Sign up and enroll to access the full audio experience
Chapter Content
• A high value of r indicates a strong linear relationship. Its value is said to be high when it is close to +1 or –1. A low value of r (close to zero) indicates a weak linear relation. But there may be a non-linear relation.
Detailed Explanation
The magnitude of the correlation coefficient conveys the strength of the relationship between variables. A value close to +1 or -1 suggests a strong linear connection, while a value near 0 suggests minimal or no linear relationship. However, it is possible for relationships to exist that are non-linear – meaning the relationship may not follow a straight line but still be significant.
Examples & Analogies
For instance, consider a graph that plots the hours studied versus test scores. A value of 0.9 may suggest that study time and score have a strong positive correlation. Conversely, a value of 0.1 may indicate very little direct relationship; however, this does not rule out other kinds of relationships, such as increased study time leading to improvements at a diminishing rate.
Bounded Range of Correlation
Chapter 6 of 8
🔒 Unlock Audio Chapter
Sign up and enroll to access the full audio experience
Chapter Content
• The value of the correlation coefficient lies between minus one and plus one, –1 ≤ r ≤1.
Detailed Explanation
The correlation coefficient is confined within a range from -1 to +1. Values outside this range would signify errors in calculation or misunderstandings of the data's relationships. A handy rule of thumb for memorizing this range is to remember that -1 indicates a perfect negative correlation while +1 indicates a perfect positive correlation.
Examples & Analogies
Consider throwing darts at a dartboard. A perfect hit in the center distinguishes excellent accuracy (1) while hitting the outermost ring represents a poor throw (-1). If your aim is variable or off-target, this indicates that your throw lacks a direct and consistent correlation to the position of the bullseye.
Effect of Changing Origin and Scale
Chapter 7 of 8
🔒 Unlock Audio Chapter
Sign up and enroll to access the full audio experience
Chapter Content
• The magnitude of r is unaffected by the change of origin and change of scale. Given two variables X and Y let us define two new variables.
Detailed Explanation
Changes in the units or scales of the variables (for example, changing from feet to inches for height) do not impact the correlation coefficient. This means that no matter how we represent or scale our data, the fundamental relationship measured will remain constant.
Examples & Analogies
Think about measuring temperature in Celsius versus Fahrenheit. If you analyze the correlation between temperature and ice cream sales, whether you report temperatures in Celsius or Fahrenheit, the correlation remains stable and informative. The relationship stays intact regardless of how you present the data numerically.
Limitation of Correlation
Chapter 8 of 8
🔒 Unlock Audio Chapter
Sign up and enroll to access the full audio experience
Chapter Content
• Zero correlation means the two variables are uncorrelated. However, other types of relationships may still exist.
Detailed Explanation
A correlation coefficient of zero indicates no linear relationship between the two variables in question. It suggests that knowing the value of one variable does not provide information about the other. Nevertheless, it is crucial to remember that zero correlation does not eliminate the possibility of there being other, non-linear relationships.
Examples & Analogies
For example, if we look at the time of year and ice cream sales, there might be no correlation in winter months but sales could spike during summer, reflecting a non-linear relationship. Thus, while they may appear unconnected upon a first glance based purely on linear correlation, underlying patterns could still exist.
Key Concepts
-
Correlation: A measure of the relationship between variables.
-
Correlation Coefficient (r): Ranges from -1 to 1, indicating strength and direction of correlation.
-
Positive Correlation: Both variables move in the same direction.
-
Negative Correlation: One variable increases while the other decreases.
-
No Correlation: No apparent relationship between the variables.
Examples & Applications
Ice-cream sales increase in hot weather indicating a positive correlation with temperature.
When the price of a commodity increases, its demand typically decreases, showing a negative correlation.
There’s no correlation between shoe sizes and IQ scores.
Memory Aids
Interactive tools to help you remember key concepts
Rhymes
When prices rise, demand may fall, a negative correlation explains it all.
Stories
Imagine two friends, Sam and Alex, who always do things together: as one jumps higher at a basketball game, the other follows— that’s positive correlation in a game of fame!
Memory Tools
Positive Correlation: Both go up, like sun with a cup of coffee. Negative Correlation: One lowers, like a sad face, it isn’t rosy.
Acronyms
PINE
Positive Increases
Negative Excludes - remember the direction of changes in correlation.
Flash Cards
Glossary
- Correlation
A statistical measure that describes the strength and direction of a relationship between two variables.
- Correlation Coefficient (r)
A numerical value between -1 and 1 that expresses the degree of relationship between two variables.
- Positive Correlation
A relationship where both variables increase or decrease together.
- Negative Correlation
A relationship where one variable increases while the other decreases.
- Spurious Correlation
A situation where two variables appear to be correlated but are actually caused by a third variable.
- Causation
The action of causing something; it implies a cause-and-effect relationship.
- Scatter Diagram
A graphical representation that displays values for two variables for a set of data.
Reference links
Supplementary resources to enhance your learning experience.