
Case 3: Repeated Ranks
Enroll to start learning
You’ve not yet enrolled in this course. Please enroll for free to listen to audio lessons, classroom podcasts and take practice test.
Interactive Audio Lesson
Listen to a student-teacher conversation explaining the topic in a relatable way.
Introduction to Correlation
🔒 Unlock Audio Lesson
Sign up and enroll to listen to this audio lesson

Today, we will discuss the fascinating concept of correlation! Correlation is a statistical measure that expresses the extent to which two variables are linearly related. Can anyone tell me why understanding correlation is vital?

It helps to find relationships between different variables, like temperature and ice cream sales!
Exactly! We can analyze how the rise in temperature leads to an increase in ice cream sales. This brings us to our first key point: Is there any relationship between two variables?

So, if one variable changes, the other might too?
Yes! Now, remember, correlation tells us if the variables move together—this is crucial. Let's keep this in mind as we progress!
Types of Correlation
🔒 Unlock Audio Lesson
Sign up and enroll to listen to this audio lesson

Now, correlation can be positive or negative. Who can define what positive correlation means?

It means that both variables increase together!
Correct! For example, as income rises, consumption also rises—this is positive correlation. On the other hand, what is negative correlation?

It's when one variable increases while the other decreases, like when the price of apples rises, and their demand falls.
Yes! That's an excellent example of negative correlation. Remember, when we say one variable changes, we should also analyze how the other responds!
Measuring Correlation
🔒 Unlock Audio Lesson
Sign up and enroll to listen to this audio lesson
To analyze correlations, we use techniques like scatter diagrams and correlation coefficients. Who remembers what a scatter diagram does?
It visually represents the relationship between variables!
Exactly! And what about Karl Pearson’s coefficient of correlation?
It gives a numerical value to the relationship between two variables!
Great! When calculating correlation, we must keep in mind that a value of 1 or -1 indicates a perfect correlation, while 0 indicates no correlation.
Introduction & Overview
Read summaries of the section's main ideas at different levels of detail.
Quick Overview
Standard
In this section, students learn about correlation analysis, exploring how to measure relationships between two variables, the different types of correlation (positive, negative, and no correlation), and how to calculate correlation coefficients using various methods. The significance of correlation in statistical analysis and common misconceptions about causation are also emphasized.
Detailed
Detailed Summary of Case 3: Repeated Ranks
Understanding Correlation
Correlation analysis systematically examines relationships between two related variables. It answers critical questions such as:
1. Is there any relationship between two variables?
2. Does one variable change with the change in another?
3. Do the variables move in the same direction?
4. How strong is the relationship between them?
Types of Relationships
Correlations can be classified primarily into positive and negative correlations. In positive correlation, both variables move in the same direction—if one increases, the other does too. Conversely, a negative correlation indicates that as one variable increases, the other decreases.
Measurement Techniques
Three main techniques are utilized to measure correlation: scatter diagrams, Karl Pearson’s coefficient of correlation, and Spearman’s rank correlation. Scatter diagrams visually represent relationships, while Pearson’s coefficient provides precise numerical values, and Spearman’s correlation is useful for ranking data that cannot be numerically measured.
Properties of Correlation Coefficient
- The correlation coefficient ranges between -1 and +1.
- Perfect positive or negative correlation occurs at -1 or +1 respectively, while 0 indicates no correlation.
- The correlation does not imply causation; instead, it merely reflects covariation.
Understanding these concepts sets the foundation for robust statistical analysis by allowing for interpretation of data patterns and relationships in economics or other fields.
Youtube Videos


Audio Book
Dive deep into the subject with an immersive audiobook experience.
Introduction to Rank Correlation Coefficient
Chapter 1 of 5
🔒 Unlock Audio Chapter
Sign up and enroll to access the full audio experience
Chapter Content
Rank correlation coefficient and simple correlation coefficient have the same interpretation. Its formula has been derived from simple correlation.
Detailed Explanation
The rank correlation coefficient measures the strength and direction of the relationship between two variables using ranks assigned to their values. Unlike the simple correlation coefficient, which uses the actual values, the rank correlation helps in situations where values are difficult to compare directly. This makes them applicable in various scenarios, especially when the values cannot be quantified accurately.
Examples & Analogies
Imagine two judges scoring talent or beauty. The judges may score contestants differently, but if we convert their scores into ranks, we can easily see how closely their opinions align. For example, if both judges rank a contestant as 1st, it shows strong agreement, while differing ranks show less alignment.
Formula for Rank Correlation
Chapter 2 of 5
🔒 Unlock Audio Chapter
Sign up and enroll to access the full audio experience
Chapter Content
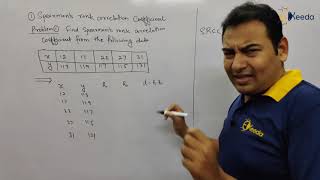
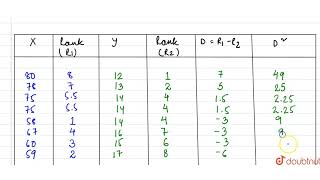
The formula of Spearman’s rank correlation coefficient when the ranks are repeated is as follows:
r = 1 - (6ΣD2) / (n3 - n)
Detailed Explanation
The formula calculates the rank correlation coefficient (r) when there are repeated ranks. Here, D represents the difference between ranks of each pair, and n is the total number of observations. This formula adjusts for tied ranks and provides a clearer measure of correlation in scenarios with non-unique rankings.
Examples & Analogies
Consider a race where two participants finish at the same time. If one participant is ranked 2nd and the other is also ranked 2nd due to the tie, the next-ranked individual gets a 3rd place. In such cases, calculating the difference (D) and applying the formula ensures that the tie influences the overall correlation appropriately.
Case Study on Rank Correlation
Chapter 3 of 5
🔒 Unlock Audio Chapter
Sign up and enroll to access the full audio experience
Chapter Content
Ranks are given. Example: Five persons are assessed by three judges in a beauty contest. We have to find out which pair of judges has the nearest approach to common perception of beauty.
Detailed Explanation
In this case study, we examine how judges rate the same contestants. Each judge gives their score, which we convert into ranks. By calculating the rank correlation, we can determine how similar the judges are in their ratings. This allows us to understand if their evaluations are aligned or if they perceive beauty differently.
Examples & Analogies
Think of a talent competition where different judges have varying tastes. Comparing their ranks can help determine if their judgments align or differ. If Judge 1 consistently ranks contestants similarly to Judge 2, it indicates they share similar standards of talent.
Calculating Rank Correlation with Different Cases
Chapter 4 of 5
🔒 Unlock Audio Chapter
Sign up and enroll to access the full audio experience
Chapter Content
The calculation of rank correlation will be illustrated under three situations: 1. The ranks are given. 2. The ranks are not given. They have to be worked out from the data. 3. Ranks are repeated.
Detailed Explanation
This segment outlines different scenarios under which the rank correlation can be calculated. In the first case, ranks are directly provided, allowing for a straightforward calculation. In the second, ranks must be generated from the data, which necessitates additional steps. In the third case, where ranks may repeat due to ties, we must adjust our calculations to avoid bias.
Examples & Analogies
Consider students competing in multiple subjects: if their scores differ greatly, we easily assign ranks. In cases where several students score the same, we average their ranks to ensure fairness. This approach ensures that every student's performance is fairly reflected in the rankings, whether we’re using direct scores or calculated ranks.
Conclusion on Rank Correlation Applications
Chapter 5 of 5
🔒 Unlock Audio Chapter
Sign up and enroll to access the full audio experience
Chapter Content
Spearman’s rank correlation coefficient is useful when measuring relationships where one variable or both cannot be measured precisely. It is advantageous in many scenarios and helps understand relationships that simple correlation could miss.
Detailed Explanation
The conclusion emphasizes the versatility of the rank correlation coefficient. It serves as an effective measure in instances where precise data is lacking or when dealing with non-linear relationships. While both simple and rank correlation assess relationships, the rank correlation is often more robust in accommodating tied or non-standard data.
Examples & Analogies
Think of emotional intelligence or leadership skills—traits that are hard to quantify. We can rank individuals based on peer assessments or observational data to derive meaningful insights. Rank correlation helps organizations identify potential leaders among their team members, even when precise metrics aren't available.
Key Concepts
-
Correlation: The measure of the relationship between two variables.
-
Positive Correlation: Both variables increase or decrease together.
-
Negative Correlation: One variable increases while the other decreases.
-
Scatter Diagram: A visual tool used to observe the relationship between 2 variables.
-
Correlation Coefficient: A numerical value that indicates the strength and direction of a linear relationship.
Examples & Applications
Example of Positive Correlation: The relationship between temperature and ice cream sales.
Example of Negative Correlation: The inverse relationship between the price of a good and its demand.
Example of no correlation: The relationship between a person's shoe size and their intelligence.
Memory Aids
Interactive tools to help you remember key concepts
Rhymes
Correlation’s a relation; it's a pattern we can see, when one goes up, the other might, just like you and me!
Stories
Imagine a sunny day where ice cream vendors are smiles rich, as the temperature rises, so do their sales – a sweet correlation pitch!
Memory Tools
P.O.S.I.T.I.V.E = Positive Outcomes Show In The Increase of Value for Everyone.
Acronyms
C.A.R.E = Correlation Analysis Reveals Everything!
Flash Cards
Glossary
- Correlation
A statistical measure that expresses the extent to which two variables are related.
- Positive Correlation
A relationship where both variables move in the same direction.
- Negative Correlation
A relationship where one variable increases while the other decreases.
- Scatter Diagram
A visual representation that plots two variables to observe their relationship.
- Pearson’s Coefficient
A numerical measure of the strength and direction of a linear relationship between two variables.
- Spearman’s Rank Correlation
A statistical measure that assesses how well the relationship between two variables can be described using a monotonic function.
Reference links
Supplementary resources to enhance your learning experience.