
Concept of Depth-Area-Duration Relationships
Enroll to start learning
You’ve not yet enrolled in this course. Please enroll for free to listen to audio lessons, classroom podcasts and take practice test.
Interactive Audio Lesson
Listen to a student-teacher conversation explaining the topic in a relatable way.
Introduction to DAD Relationships
🔒 Unlock Audio Lesson
Sign up and enroll to listen to this audio lesson

Today, we'll dive into the Depth-Area-Duration, or DAD relationships. Can anyone tell me what you think this might involve?

Maybe it has to do with how much rain falls over a specific area?
Exactly! It's about understanding how much rain falls in different areas over time. Depth, area, and duration are the three key components. Who can tell me what happens to the depth as the area increases?

I think the depth decreases with a larger area!
That's right! There’s an inverse relationship here. Remember, we can summarize it with the acronym DAD - Depth decreases with Area, Duration stays fixed. Great job!
Deriving DAD Relationships
🔒 Unlock Audio Lesson
Sign up and enroll to listen to this audio lesson

Now, let's discuss how DAD relationships are derived. What kind of data do you think we need?

We probably need information from past storm events?
Correct! Specifically, we need storm event data and a rain gauge network. What method do you think we could use to visualize this data?

Maybe the Isohyetal method, where we draw lines of equal rainfall?
Exactly! The Isohyetal method helps us create averaged rainfall depth over areas. Keep that method in mind; it's a fundamental part of our analysis!
Applications of DAD Relationships
🔒 Unlock Audio Lesson
Sign up and enroll to listen to this audio lesson
Finally, let's explore the applications of DAD relationships. Can anyone think of where they might be useful?
They could help in designing dams and reservoirs!
Absolutely! They're also crucial for flood estimation and understanding watershed behaviors. Remember, these relationships are key to hydrologic design.
So they help prevent flooding by guiding designs?
Correct! DAD helps ensure that watersheds can manage stormwater effectively, minimizing flood risks.
Introduction & Overview
Read summaries of the section's main ideas at different levels of detail.
Quick Overview
Standard
Depth-Area-Duration (DAD) relationships are critical for hydrologic analysis in flood control and reservoir planning. These relationships describe how rainfall depth varies with area size and storm duration, which is essential for designing effective hydrological structures and flood estimation.
Detailed
Concept of Depth-Area-Duration Relationships
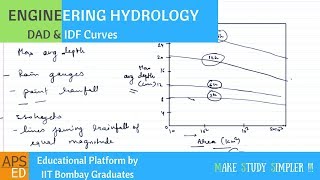
The Depth-Area-Duration (DAD) relationship depicts how rainfall depth, area, and duration interconnect in hydrology. As precipitation occurs unevenly across various regions, understanding these relationships helps accurately estimate the average rainfall required for different sizes of catchment areas over specific storm durations.
Key Elements of DAD Relationships:
- Depth of Precipitation: Measured in mm or cm, this reflects how much rainfall occurs.
- Area of the Storm: Indicates the size of the area affected by the storm, measured in km².
- Duration of the Storm: Time frame over which the rainfall occurs, expressed in hours or days.
Importance of DAD Relationships:
This methodology is derived from analyzing historical storm data, aiding engineers and hydrologists in designing resilient infrastructures, estimating floods, and understanding rainfall distribution in watersheds.
Youtube Videos


Audio Book
Dive deep into the subject with an immersive audiobook experience.
Understanding DAD Curves
Chapter 1 of 2
🔒 Unlock Audio Chapter
Sign up and enroll to access the full audio experience
Chapter Content
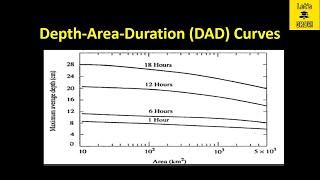
The Depth-Area-Duration (DAD) curve expresses the relationship between:
• Depth of precipitation (in mm or cm),
• Area over which it falls (in km2), and
• Duration of the storm (in hours or days).
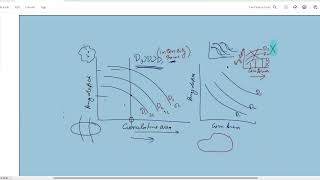
It illustrates how rainfall depth decreases with increasing area for a given duration and vice versa.
Detailed Explanation
DAD curves help us understand how rainfall is distributed over an area and how it relates to the extent of that area and the time over which it falls. For example, if a storm lasts for a certain number of hours, the amount of rain (depth) collected will be different depending on the size of the area that is receiving that rain. As the area increases, the depth of the rain generally decreases for the same duration of the storm. This relationship is critical for designing infrastructure and managing water resources.
Examples & Analogies
Imagine you have a sponge and you’re pouring water on it. If you pour slowly, the sponge gets soaked, which is like a storm on a small area (high depth). But if you try to soak a larger sponge with the same amount of water, you will notice that it won’t be able to hold as much water per unit area - it’s spread out over a larger surface. This is similar to how rainfall depth decreases over larger areas.
Deriving DAD Relationships
Chapter 2 of 2
🔒 Unlock Audio Chapter
Sign up and enroll to access the full audio experience
Chapter Content
This relationship is generally derived from historical storm data, which is analyzed to find average areal precipitation for different durations and areas.
Detailed Explanation
To create DAD curves, researchers analyze historical data from past storms. They gather information on how much rain fell in a specific area over a certain period. By comparing many past storms, they can find patterns in rainfall that help predict how future storms might behave. This historical analysis is vital because it forms the basis for understanding rainfall trends and their implications for flood management and infrastructure design.
Examples & Analogies
Think of it like studying a series of tests you've taken. By looking at your past performance on different tests (historical data), you can understand your strengths and weaknesses and make predictions about how you might do on future tests. Similarly, meteorologists study past storm data to make educated guesses about future rainfall events.
Key Concepts
-
DAD Curve: A graphical representation showing the relationship between rainfall depth, area, and duration.
-
Spatial Variability: The variation in rainfall distribution over different geographic areas.
-
Hydrological Models: Tools used to simulate water cycle processes in watersheds.
Examples & Applications
An example of a DAD curve shows how a rainfall depth of 100mm is expected over 10 km² for a 2-hour duration, but if the area expands to 100 km², the expected depth might drop to 60mm.
Historical storm data collected from a region reveals that shorter, intense storms produce more significant rainfall quickly compared to longer, steadier storms across wider areas.
Memory Aids
Interactive tools to help you remember key concepts
Rhymes
Rain comes down in a DAD way, depth and area lead the play.
Stories
Imagine a gardener watering a large garden. As he uses the same amount of water, he realizes that the bigger the garden, the less water reaches each plant – just like how rain depth decreases over larger areas.
Memory Tools
Remember 'DAD' - Depth, Area, Duration all relate, but more area means less rain at a rate!
Acronyms
DAD
'Depth decreases as Area grows
Duration remains fixed
this everyone knows!'
Flash Cards
Glossary
- DepthAreaDuration (DAD)
A relationship that describes how the depth of precipitation varies with the area affected and the duration of the storm.
- Isohyetal Method
A technique for estimating areal average rainfall by drawing lines connecting points of equal rainfall.
- Rain Gauge
An instrument used to measure the amount of rainfall in a specific area over a period.
Reference links
Supplementary resources to enhance your learning experience.