
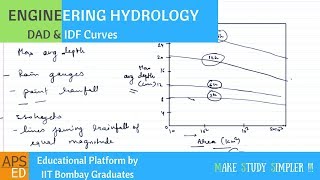
Derivation of DAD Curves
Enroll to start learning
You’ve not yet enrolled in this course. Please enroll for free to listen to audio lessons, classroom podcasts and take practice test.
Interactive Audio Lesson
Listen to a student-teacher conversation explaining the topic in a relatable way.
Data Requirements for DAD Curves
🔒 Unlock Audio Lesson
Sign up and enroll to listen to this audio lesson

To derive DAD curves, what kind of data do we need?

We need storm event data!
That's right! We also need a rain gauge network across the region and time-series rainfall data. Why do you think these factors are important?

I guess without accurate rainfall data, we can't really understand the variability!
Exactly! The vastness and detail of the data will significantly affect how well we can model the rainfall distribution. Remember: 'Good data leads to good decisions.'
Isohyetal Method
🔒 Unlock Audio Lesson
Sign up and enroll to listen to this audio lesson

What do you think the isohyetal method is used for in deriving DAD curves?

To create a visual representation of rainfall over an area?
Yes! We draw isohyets or lines of equal rainfall across the storm area to estimate the average. What do you think happens next?

We calculate the area between those lines?
Correct! This area allows us to compute the total rainfall volume and derive averages for different areas. Remember: 'Isohyets help us visualize the unseen.'
Significance of DAD Curves
🔒 Unlock Audio Lesson
Sign up and enroll to listen to this audio lesson
How do you think DAD curves help in hydrologic design?
They guide the construction of things like dams and storm sewers!
And they help estimate flood risks too!
Absolutely! DAD curves are fundamental for predicting how rainwater flows in different regions during storms. Can anyone explain the broader implications?
I think accurate predictions can help in managing water resources effectively!
Well said! Remember: 'DAD curves shape our understanding of water management.'
Introduction & Overview
Read summaries of the section's main ideas at different levels of detail.
Quick Overview
Standard
In deriving DAD curves, historical storm data is analyzed to understand the relationship between rainfall depth, area, and duration. Essential data requirements, along with the isohyetal method for calculating areal average rainfall, are highlighted as critical components of this derivation process.
Detailed
The section describes the derivation of Depth-Area-Duration (DAD) curves vital for understanding rainfall distribution over different areas and storm durations. To develop DAD relationships, several data types are necessary: historical storm event data from an extensive rain gauge network, and detailed time-series rainfall records. The isohyetal method is presented as a common approach for establishing average rainfall; this involves creating isohyets—lines connecting points of equal rainfall—over the storm area. The area between these lines is calculated to estimate total rainfall volume, which is then averaged over the respective area. The resulting data points form the basis for establishing cumulative depth-area-duration relationships that are crucial for hydrologic analysis and engineering design.
Youtube Videos


Audio Book
Dive deep into the subject with an immersive audiobook experience.
Data Requirements
Chapter 1 of 2
🔒 Unlock Audio Chapter
Sign up and enroll to access the full audio experience
Chapter Content
To develop DAD relationships, the following are required:
- Storm event data (preferably from extreme or major storms)
- Rain gauge network across the region
- Time-series rainfall data at each gauge
Detailed Explanation
To derive DAD curves, it is essential to gather relevant data. This includes:
1. Storm Event Data: This is data collected from significant storm events, particularly extreme storms, as they provide critical insights into rainfall behavior during severe weather. Historical records of major storms help in establishing patterns.
2. Rain Gauge Network: A well-distributed network of rain gauges is crucial. These instruments measure rainfall at specific locations, enabling hydrologists to assess spatial rainfall distribution across the region.
3. Time-Series Rainfall Data: This data is collected over time and is needed for each gauge to understand changes and trends in rainfall. It provides a timeline of rainfall events and assists in analyzing their frequency and intensity.
Examples & Analogies
Think of the data requirements like preparing for a big event, like a concert. To have a successful concert, you need:
1. Concert history (like storm event data) to know which bands perform best.
2. A sound system and microphones (like a rain gauge network), ensuring music reaches everyone in the audience.
3. A schedule of past events (time-series data) to plan effectively for the next one, considering what worked and what didn’t.
Isohyetal Method
Chapter 2 of 2
🔒 Unlock Audio Chapter
Sign up and enroll to access the full audio experience
Chapter Content
One of the most common methods for calculating areal average rainfall is the Isohyetal method, where:
- Isohyets (lines of equal rainfall) are drawn over the storm area.
- The area between isohyets is computed.
- The volume of rainfall is estimated and averaged over the area.
This gives averaged depths for sub-areas, which are then used to create cumulative depth-area-duration data points.
Detailed Explanation
The Isohyetal method is a technique used in DAD curve derivation that provides a visual representation of rainfall distribution. The process consists of:
1. Drawing Isohyets: Isohyets are lines on a map that connect points of equal rainfall. By drawing these lines across the storm area, hydrologists can visualize how much rain fell in different locations.
2. Calculating Area Between Isohyets: The areas bordered by these lines are measured. Each area represents a section of the storm region with a specific rainfall depth.
3. Estimating Rainfall Volume: After defining these areas, the total volume of rainfall is estimated and averaged over the entire area to find an average rainfall depth. This step is crucial for calculating how much water is contributed to the region by the storm.
Examples & Analogies
Imagine looking at a large map of a city after a heavy snowfall. You draw lines around regions that received equal amounts of snow. By calculating the area for each region, you can estimate how much total snow fell. This is similar to the Isohyetal method: drawing isohyets provides a clear picture of rainfall distribution, which helps in understanding the storm's impact on different areas.
Key Concepts
-
Depth-Area-Duration Relationship: A method to estimate rainfall based on area and duration.
-
Isohyetal Method: A technique for estimating areal average rainfall by drawing isohyets.
-
Data Requirements: Essential historical storm event, rain gauge, and rainfall data are required for DAD curve derivation.
Examples & Applications
Example of how to apply the isohyetal method to calculate total rainfall for a given storm area.
A case study showing the effect of DAD curves in urban flood risk assessment.
Memory Aids
Interactive tools to help you remember key concepts
Rhymes
For rain that's not plain, look at the DAD and see the gain!
Stories
Imagine a rain wizard who uses isohyets to paint the sky, showing depth across every area in a storm.
Memory Tools
I.D.R.C.: Isohyetal method, Data requirements, Rainfall distribution Curves.
Acronyms
DAD
Depth
Area
Duration.
Flash Cards
Glossary
- DepthAreaDuration (DAD) Curve
A graphical representation showing the relationship between precipitation depth, area, and storm duration.
- Isohyet
A line on a map connecting points of equal rainfall depth.
- Rain Gauge Network
An array of instruments used for measuring rainfall at specific locations.
- Storm Event Data
Historical records of precipitation and storms used to analyze rainfall.
- TimeSeries Rainfall Data
Data that records rainfall amounts over different time intervals.
Reference links
Supplementary resources to enhance your learning experience.