
Depth-Area-Duration Analysis Procedure
Enroll to start learning
You’ve not yet enrolled in this course. Please enroll for free to listen to audio lessons, classroom podcasts and take practice test.
Interactive Audio Lesson
Listen to a student-teacher conversation explaining the topic in a relatable way.
Introduction to DAD Analysis Procedure
🔒 Unlock Audio Lesson
Sign up and enroll to listen to this audio lesson

Today, we'll start discussing the Depth-Area-Duration Analysis Procedure, which is crucial for understanding how rainfall affects hydrologic systems. Can anyone tell me why estimating rainfall distribution is important?

It helps in flood control, right?
Exactly! Estimating rainfall distribution is vital for flood control and designing reservoirs. Now, let's dive into the procedure. What do you think is the first step?

Collecting rainfall data?
Correct! Collecting rainfall data from various storm events is essential, as it ensures we have a comprehensive view of how different areas behave under varying conditions. Remember this acronym, 'CRD' for Collect, Rainfall, and Data.
Plotting Isohyets
🔒 Unlock Audio Lesson
Sign up and enroll to listen to this audio lesson

Once we have our data, the next step is to plot isohyets. What are isohyets?

They are lines that connect points of equal rainfall, right?
Absolutely! By plotting isohyets, we can visually represent rainfall distribution over an area. This visualization is important for further calculations of average precipitation. How do you think this helps with the overall analysis?

It allows us to see how rainfall is spread out, which is useful for calculating averages?
Exactly! It aids in computing average precipitation over specified areas.
Calculating Average Precipitation
🔒 Unlock Audio Lesson
Sign up and enroll to listen to this audio lesson
After we plot the isohyets, we calculate average precipitation using methods like isohyetal or Thiessen methods. Who can tell me what the Thiessen method does?
It divides the area into smaller polygons around each rain gauge to calculate averages?
Correct! This method gives a better representation in areas with sparse data. The next step is tabulating depth versus area for different durations. Why might this be important?
It helps us see how depth changes with different storm sizes?
Yes! Good point! Tabulating this data allows us to analyze relationships better.
Plotting DAD Curves
🔒 Unlock Audio Lesson
Sign up and enroll to listen to this audio lesson
Now that we have our data, we plot the DAD curves. Why is it often done on logarithmic scales?
Because it helps to linearize the data and makes patterns more visible?
Exactly! Plotting on logarithmic scales helps analyze relationships effectively and clearly. What's the final step we perform with these curves?
We fit equations to determine constants?
Correct! Fitting equations to the DAD curves allows us to use these relationships in practical applications, such as estimating flood risks.
Introduction & Overview
Read summaries of the section's main ideas at different levels of detail.
Quick Overview
Standard
This section describes the steps involved in conducting Depth-Area-Duration analysis, which is crucial for accurate hydrologic modeling and infrastructure design. It emphasizes data collection, isohyetal plotting, precipitation calculation, and the creation of DAD curves.
Detailed
Depth-Area-Duration Analysis Procedure
The Depth-Area-Duration (DAD) analysis procedure is an essential framework for hydrologists to quantify precipitation over different spatial scales and time durations effectively.
Steps in the DAD Analysis Procedure:
- Collect Rainfall Data: The first step involves gathering a comprehensive dataset of rainfall measurements from various storm events, emphasizing the importance of capturing variability across different durations.
- Plot Isohyets on Maps: Once data is collected, isohyets, which are lines of equal rainfall, are plotted on maps for each storm duration, visually depicting rainfall distribution over the area.
- Calculate Average Precipitation: Utilizing isohyetal or Thiessen methods, average precipitation for different areas is computed, helping to achieve a more representative understanding of the rainfall depth across the watershed.
- Tabulate Depth vs. Area: This step involves organizing the collected data into a table that correlates rainfall depth with catchment area for varying storm durations, enabling a clear view of the relationship between these parameters.
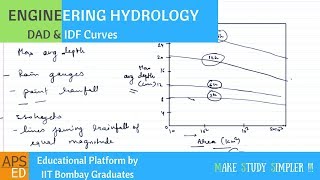
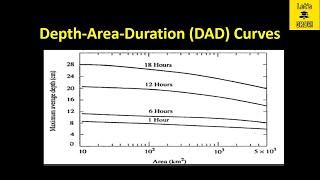
- Plot DAD Curves: With the tabulated data, DAD curves are plotted on logarithmic scales, which helps in analyzing the relationship between depth, area, and duration systematically and accurately.
- Fit Appropriate Equations: The final step includes determining the best-fit equations for the DAD curves, allowing hydrologists to use these relationships in practical applications, such as flood risk assessment and reservoir design.
The significance of this procedure lies in its application in various hydrologic studies and infrastructure design, helping engineers and planners predict rainfall impacts on water resources effectively.
Youtube Videos


Audio Book
Dive deep into the subject with an immersive audiobook experience.
Step 1: Collect Rainfall Data
Chapter 1 of 6
🔒 Unlock Audio Chapter
Sign up and enroll to access the full audio experience
Chapter Content
Step 1: Collect rainfall data from storm events of various durations.
Detailed Explanation
In the first step of the Depth-Area-Duration analysis procedure, hydrologists must gather rainfall data from various storm events. These data should include precipitation measurements over different durations, which could range from minutes to several days. This data collection is critical because it serves as the foundation for understanding how rainfall varies spatially and temporally across an area.
Examples & Analogies
Think of this step like collecting ingredients before baking a cake. Just as you need flour, eggs, and sugar to make a cake, you need diverse rainfall data to create an accurate DAD analysis. If you miss an important ingredient, your cake (or analysis, in this case) might not turn out right.
Step 2: Plotting Isohyets
Chapter 2 of 6
🔒 Unlock Audio Chapter
Sign up and enroll to access the full audio experience
Chapter Content
Step 2: Plot isohyets on maps for each duration.
Detailed Explanation
The second step involves creating isohyets, which are lines that connect points of equal rainfall depth on a map. For each collected duration, a map is made that visually represents how rainfall is distributed across the studied area. This helps in visualizing the rainfall pattern and understanding how rainfall varies spatially across different zones within the storm area.
Examples & Analogies
Imagine drawing a treasure map where you mark areas that have the same amount of treasure. Each line on the isohyet map is like a treasure line that shows where the rainfall is the same. This visual representation makes it easier to identify how heavy the rainfall is in different areas.
Step 3: Calculate Average Precipitation
Chapter 3 of 6
🔒 Unlock Audio Chapter
Sign up and enroll to access the full audio experience
Chapter Content
Step 3: Calculate average precipitation for areas using isohyetal or Thiessen methods.
Detailed Explanation
In step three, average precipitation is calculated for different areas using one of two common methods: the Isohyetal method or the Thiessen method. The Isohyetal method averages rainfall by measuring the areas between isohyets while the Thiessen method divides the area into segments based on proximity to rainfall gauges. This ensures that the average rainfall is accurately represented for each specific area of interest.
Examples & Analogies
Think of this step as dividing a pizza into slices. Each slice represents an area that receives a different level of rainfall, and we calculate the average amount of 'toppings' (or rainfall) in each slice to ensure each person (or area) has their fair share.
Step 4: Tabulate Depth vs. Area
Chapter 4 of 6
🔒 Unlock Audio Chapter
Sign up and enroll to access the full audio experience
Chapter Content
Step 4: Tabulate depth vs area for different durations.
Detailed Explanation
In step four, the collected rainfall depths are organized systematically into a table that shows the relationship between rainfall depth and area for different storm durations. This table serves as a reference for understanding how depth varies with the physical size of the area affected by rainfall, which is vital for further analyses.
Examples & Analogies
Imagine you're organizing a field trip where you note the number of students attending from each class (area) and how much they enjoy different activities (depth). The resulting table will help you figure out which activities are popular in which class, guiding future decisions.
Step 5: Plotting DAD Curves
Chapter 5 of 6
🔒 Unlock Audio Chapter
Sign up and enroll to access the full audio experience
Chapter Content
Step 5: Plot DAD curves on logarithmic scales.
Detailed Explanation
Step five involves the visualization of the data by plotting the Depth-Area-Duration curves on a logarithmic scale. This enables clearer visualization of how rainfall depth decreases as the area increases, which is often seen as a typical DAD pattern. Logarithmic scales help in handling large ranges of data values effectively, allowing for better interpretation and analysis.
Examples & Analogies
Consider how you might plot the growth of plants in your garden over time. If one plant grows to 1 meter and another to 100 meters, using a regular scale would make the smaller plant look insignificant. A logarithmic scale would allow you to visualize both effectively, similar to how DAD curves help us understand rainfall at various scales.
Step 6: Fitting Equations
Chapter 6 of 6
🔒 Unlock Audio Chapter
Sign up and enroll to access the full audio experience
Chapter Content
Step 6: Fit appropriate equations and determine constants.
Detailed Explanation
The final step is to fit appropriate mathematical equations to the plotted DAD curves and determine the necessary constants for these equations. This process often involves selecting a model that best describes the relationship observed between rainfall depth, area, and duration, allowing for future predictions and analyses.
Examples & Analogies
This step can be compared to finding the right recipe adjustments for your favorite dish. You might need to tweak ingredient amounts or processes based on your previous cooking experiences (the data you've collected). This fitting ensures that your recipe (or analysis) works well in different conditions.
Key Concepts
-
Collecting Rainfall Data: Gathering of rainfall measurements from different events is essential for accurate analysis.
-
Isohyets: Lines representing equal rainfall and their importance in visualizing rainfall distribution.
-
Thiessen Method: A technique for calculating areal averages that provides accurate results with sparse data.
Examples & Applications
An example of applying the Thiessen method where an area has rainfall data from three gauges, allowing for precise average calculations.
Using DAD curves derived from historical data to estimate the probable maximum precipitation needed for dam designs.
Memory Aids
Interactive tools to help you remember key concepts
Rhymes
Collect data, plot it right, Isohyets bring rainfall insight.
Stories
Imagine a hydrologist in a storm, collecting rain samples for a report. He draws isohyets like lines of a map, watching rainfall forms and patterns unwrap.
Memory Tools
CRP-TDF: Collect Rainfall, Plot Isohyets, Tabulate Depth vs. Area, Fit Equations to determine constants.
Acronyms
DAD
Depth
Area
Duration - Remember the three crucial elements of this analysis.
Flash Cards
Glossary
- DepthAreaDuration (DAD) Analysis
A method used to estimate average rainfall over varying areas and durations from point rainfall measurements.
- Isohyets
Lines of equal rainfall on a map, used to visualize rainfall distribution.
- Thiessen Method
A method for calculating areal average rainfall by dividing the area into polygons around each rain gauge.
Reference links
Supplementary resources to enhance your learning experience.