
Depth-Area-Duration Relationships
Enroll to start learning
You’ve not yet enrolled in this course. Please enroll for free to listen to audio lessons, classroom podcasts and take practice test.
Interactive Audio Lesson
Listen to a student-teacher conversation explaining the topic in a relatable way.
Introduction to Depth-Area-Duration Relationships
🔒 Unlock Audio Lesson
Sign up and enroll to listen to this audio lesson

Welcome everyone! Today, we will explore Depth-Area-Duration relationships, often abbreviated as DAD. Can anyone tell me why estimating rainfall distribution is vital for hydrologic analysis?

Because rain doesn't fall uniformly over an area, right?
Exactly! This spatial variability is crucial, especially when designing flood control systems. The DAD relationship helps us quantify this variability effectively. We often think of it as a curve that represents how depth, area, and duration relate to each other. Can anyone recall the main factors represented in a DAD curve?

Depth of rainfall, area covered, and the duration of the storm?
Perfect! Remember, for a fixed duration, the depth decreases as the area increases. Here’s a mnemonic: 'The deeper the puddle, the smaller the area!' Let's move on to why these curves are important.
Importance of DAD Curves
🔒 Unlock Audio Lesson
Sign up and enroll to listen to this audio lesson

Why do we need DAD curves? They are essential for hydrologic design! Can anyone give examples of where they might be used?

Like in designing dams and reservoirs?

And for estimating flood impacts?
Absolutely! DAD curves are used in flood estimation and determining probable maximum precipitation, or PMP. Did you notice how we often use historical storm data to derive these curves? What insights do they provide?
They help us understand rainfall intensity over different areas!
Exactly! Remember, these relationships guide many aspects of water resource management.
General Characteristics of DAD Curves
🔒 Unlock Audio Lesson
Sign up and enroll to listen to this audio lesson
Now, let’s look at the characteristics of DAD curves. Can anyone summarize what happens to rainfall depth as the area increases?
The rainfall depth decreases!
Correct! And for a fixed area, what happens when we increase the storm duration?
The rainfall depth increases, up to a limit!
Right! DAD curves can often be plotted on logarithmic scales. Here’s a memory aid: 'Log it as you go, depth will show!' This helps in better understanding the data disparities. Any questions on how we visualize these relationships?
Introduction & Overview
Read summaries of the section's main ideas at different levels of detail.
Quick Overview
Standard
Depth-Area-Duration (DAD) relationships describe the interaction between rainfall depth, area, and storm duration, illustrating how these factors influence each other. These relationships are crucial for hydrologic design, flood estimation, and estimating probable maximum precipitation (PMP).
Detailed
Depth-Area-Duration Relationships
Introduction
In hydrologic analysis, particularly regarding flood control and reservoir planning, accurately estimating rainfall distribution in both time and space is crucial. Storms do not produce uniform rainfall across areas, making the consideration of spatial variability essential. The Depth-Area-Duration (DAD) relationship serves as a systematic approach to estimate average rainfall based on point measurements.
1. Concept of Depth-Area-Duration Relationships
The DAD curve captures:
- Depth of precipitation (in mm or cm)
- Area covered (in km²)
- Storm duration (in hours or days)
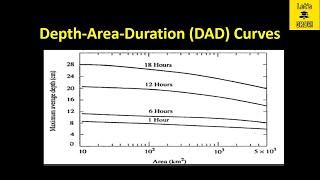
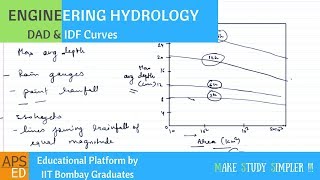
These curves indicate that rainfall depth decreases as the area increases for a given duration.
2. Need and Importance
DAD curves are critical in many hydrologic designs, including dams and flood estimation, as they provide insights into the spatial distribution of precipitation.
3. General Characteristics of DAD Curves
DAD curves have distinct characteristics, such as the decrease in depth with increasing area for fixed durations.
4. Derivation of DAD Curves
To derive DAD relationships, storm event data and a comprehensive rain gauge network are required. The Isohyetal method is often used to calculate average rainfall over an area.
5. Empirical Formulation of DAD Relationships
Several empirical equations exist to describe DAD relationships, helping to facilitate the understanding of precipitation depth over areas.
6. Factors Affecting DAD Relationships
These include topography, storm type, seasonality, and rainfall intensity, which all influence the DAD curves.
7. Depth-Area-Duration Analysis Procedure
The analysis follows a systematic procedure starting with data collection and culminating in the plotting of DAD curves.
8. Use in Estimating Probable Maximum Precipitation (PMP)
PMP estimation is essential for flood modeling, relying on historical extreme storm data.
9. Regional DAD Studies in India
DAD analyses performed by organizations like the IMD and CWC provide vital data for design and safety related to storm impacts in various regions.
10. Limitations of DAD Curves
Limitations exist with regard to the assumption of stationarity and data scarcity, alongside the empirical nature of the curves.
11. Advanced Approaches and Modern Tools
New technology enhances the analysis, including radar-based measurements and GIS tools.
12. Applications in Engineering Design
DAD relationships play an indispensable role in engineering, from storm design to runoff estimation.
Youtube Videos


Audio Book
Dive deep into the subject with an immersive audiobook experience.
Concept of Depth-Area-Duration Relationships
Chapter 1 of 4
🔒 Unlock Audio Chapter
Sign up and enroll to access the full audio experience
Chapter Content
The Depth-Area-Duration (DAD) curve expresses the relationship between:
• Depth of precipitation (in mm or cm),
• Area over which it falls (in km2), and
• Duration of the storm (in hours or days).
It illustrates how rainfall depth decreases with increasing area for a given duration and vice versa.
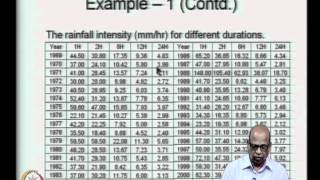
This relationship is generally derived from historical storm data, which is analyzed to find average areal precipitation for different durations and areas.
Detailed Explanation
The Depth-Area-Duration (DAD) relationship helps to understand how rainfall varies across different geographic areas and time scales. It specifically outlines three main components: the depth of precipitation, the area over which rain is falling, and the duration of the rain event. Importantly, as the area increases, the average depth of rainfall tends to decrease for a specific duration. This highlights that larger areas generally receive less intense rainfall due to the distribution of clouds and moisture.
Examples & Analogies
Imagine you have a sponge that can hold water. If you pour a small amount of water on a small sponge, it absorbs it completely and becomes very wet (high depth of rainfall). However, if you pour the same amount of water onto a large sponge, it spreads over a bigger area, making each part of the sponge less wet (lower depth of rainfall). This illustrates the principle behind DAD relationships.
Need and Importance
Chapter 2 of 4
🔒 Unlock Audio Chapter
Sign up and enroll to access the full audio experience
Chapter Content
- Hydrologic design: DAD curves are essential in the design of dams, reservoirs, spillways, storm sewers, and culverts.
- Flood estimation: Used to determine the input for flood hydrograph analysis.
- Catchment analysis: Helps in understanding the spatial distribution of precipitation in watersheds.
- Estimation of PMP: Forms the basis for probable maximum flood (PMF) analysis.
Detailed Explanation
The DAD relationships are crucial in several fields of hydrology and water resource management. They play a key role in hydrologic design by providing necessary data for constructing infrastructure such as dams and storm sewers. Moreover, they are used for flood estimation, allowing engineers to assess potential flood events accurately. They help in understanding how precipitation is distributed over different catchment areas and are essential for estimating Probable Maximum Precipitation (PMP), which is vital for flood risk management.
Examples & Analogies
Think of DAD relationships as a tool that helps engineers plan for heavy rain, much like an architect uses a blueprint to design a building. Just as the architect understands how the building will look and hold up under different conditions, engineers use DAD curves to understand how water will flow in a watershed during storms, ensuring they design effective flood control systems.
General Characteristics of DAD Curves
Chapter 3 of 4
🔒 Unlock Audio Chapter
Sign up and enroll to access the full audio experience
Chapter Content
The typical characteristics of DAD curves include:
• For a fixed duration, rainfall depth decreases as the area increases.
• For a fixed area, rainfall depth increases with duration up to a certain limit.
• The curves tend to flatten out for large areas or durations due to spatial and temporal averaging.
DAD curves are usually plotted on log-log or semi-logarithmic scales, with area on the x-axis and rainfall depth on the y-axis.
Detailed Explanation
DAD curves exhibit distinct patterns that are useful for predicting rainfall behavior. Firstly, the relationship shows that if you maintain a constant duration of rain, as the area increases, the average depth of rainfall decreases. Conversely, if you keep the area constant, the rainfall depth will increase with longer storm durations until it reaches a maximum. Additionally, for very large areas or long durations, the DAD curves start to level off; this is due to the averaging effect, where localized heavy rains balance out with lighter rains across a broader area. Engineers often depict these curves on different scales to capture these relationships clearly.
Examples & Analogies
Imagine a long car ride with your friends. If you stop at a small town for just an hour, you can all enjoy ice cream together (high intensity of fun). But if you stop at a big city for a whole day, you might all get tired and lose some excitement as there’s too much to do (averaged excitement). The way you experience 'fun' is a metaphor for how rainfall behaves in areas of differing sizes and durations.
Derivation of DAD Curves
Chapter 4 of 4
🔒 Unlock Audio Chapter
Sign up and enroll to access the full audio experience
Chapter Content
12.4.1 Data Requirements
To develop DAD relationships, the following are required:
• Storm event data (preferably from extreme or major storms)
• Rain gauge network across the region
• Time-series rainfall data at each gauge
12.4.2 Isohyetal Method
One of the most common methods for calculating areal average rainfall is the Isohyetal method, where:
• Isohyets (lines of equal rainfall) are drawn over the storm area.
• The area between isohyets is computed.
• The volume of rainfall is estimated and averaged over the area.
This gives averaged depths for sub-areas, which are then used to create cumulative depth-area-duration data points.
Detailed Explanation
To derive DAD curves, several critical types of data are necessary. First, one needs historical data from significant storm events, as these provide insights into how rainfall behaves under different conditions. Also required is a network of rain gauges to capture rainfall measurements across the region over time. A popular method for calculating average rainfall distribution is the Isohyetal method. This method involves creating lines on maps that connect points receiving the same amount of rainfall (isohyets) and calculating the area and average depth of rainfall between these lines. This information is foundational for creating DAD data points.
Examples & Analogies
Think of creating a temperature map of a city on a hot day. You have thermometers placed at different locations. You check the readings and draw lines connecting areas with similar temperatures (like isohyets for rainfall). By calculating the area under those lines, you can determine how hot (or in this case, how much rain fell) in each section of the city.
Key Concepts
-
DAD Relationships: They demonstrate how depth, area, and storm duration interrelate.
-
Isohyetal Method: A common technique for averaging rainfall over areas.
-
Empirical Formulation: Various equations that describe rainfall relationships.
Examples & Applications
Using historical data from a region to plot a DAD curve helps estimate rain for large catchment areas effectively.
Analysing a severe storm's data to derive DAD curves for flood risk assessment.
Memory Aids
Interactive tools to help you remember key concepts
Rhymes
DAD must track, depth and area in a pack!
Stories
Imagine a storm with many raindrops, each one trying to cover a different area. The deeper the puddle, the fewer raindrops are needed to cover a larger space.
Memory Tools
DAD stands for Depth, Area, Duration - remember this for hydrology!
Acronyms
DAD can also mean 'Decreasing As Area increases' for rainfall depth.
Flash Cards
Glossary
- DepthAreaDuration (DAD)
A relationship that expresses how the depth of precipitation varies with the area and duration of rainfall.
- Isohyetal Method
A technique to calculate areal average rainfall by drawing lines of equal rainfall on maps.
- Probable Maximum Precipitation (PMP)
The estimated maximum precipitation that could occur at a location based on historical data.
- Storm Hydrograph
A graphical representation of discharge overtime during and after a storm.
Reference links
Supplementary resources to enhance your learning experience.