
Factors Affecting DAD Relationships
Enroll to start learning
You’ve not yet enrolled in this course. Please enroll for free to listen to audio lessons, classroom podcasts and take practice test.
Interactive Audio Lesson
Listen to a student-teacher conversation explaining the topic in a relatable way.
Impact of Topography on DAD Relationships
🔒 Unlock Audio Lesson
Sign up and enroll to listen to this audio lesson

Today, we will discuss how topography influences DAD relationships. Can anyone describe what we mean by topography?

Isn't it related to the physical features of the land, like mountains and valleys?
Exactly! In areas with hills, we often see orographic effects that can lead to significant variations in rainfall depth. Can anyone think of an example of this?

I think mountain ranges can make one side get a lot of rain while the other side stays dry, right?
Exactly, that's a great observation! So remember, when analyzing storm data, the land's layout—its topography—plays a crucial role.

Can we use a mnemonic to memorize this? Something like 'High hills hold heavy rain'?
That's a fantastic mnemonic! Let's summarize: Topography alters rainfall distribution, especially through orographic effects.
Storm Type and its Influence
🔒 Unlock Audio Lesson
Sign up and enroll to listen to this audio lesson

Next, let's examine how storm types affect DAD curves. Who can tell me the difference between convective and frontal storms?

Convective storms are those that are localized, while frontal storms cover larger areas, right?
That's correct! Convective storms tend to produce steeper DAD curves. Can you think of what might cause that steep curve?
Maybe because they drop a lot of rain in a short time?
Exactly! This variability is crucial for flood management. What have we learned today about storm type?
Different storms lead to different patterns of rainfall, affecting how we design our models!
Seasonality and Rainfall Patterns
🔒 Unlock Audio Lesson
Sign up and enroll to listen to this audio lesson
Now, let's discuss seasonality. How do seasons affect rainfall patterns, particularly DAD relationships?
Different seasons bring different storms; for example, monsoon storms are usually very intense.
Right! Monsoon and post-monsoon cyclones behave differently. Can anyone explain how?
I think monsoons bring heavy rain at once, while cyclones spread it more evenly over a longer time?
Perfect! Remember, the timing of storms contributes greatly to their intensity and distribution.
Can we make a rhyme? Something like 'Monsoons rush, while cyclones hush'?
That’s a poetic way to remember this difference! Let’s summarize: Seasonality affects rainfall intensity and distribution.
Influence of Rainfall Intensity
🔒 Unlock Audio Lesson
Sign up and enroll to listen to this audio lesson
Let's move on to rainfall intensity. How do you think intense storms influence DAD relationships?
More intense storms drop rain quickly, creating sharper changes in curves.
Right! High-intensity storms typically lead to steeper DAD curves. What implication does this have for flood management?
We need to be prepared for flash floods, especially in urban areas.
Exactly! A strong understanding of rainfall intensity helps engineers design better flood control systems.
Could we remember this with the acronym 'SHIF' for Sharp High Intensity Flood?
Excellent acronym! Let’s recap: Rainfall intensity creates sharper DAD curves and helps in flood management.
Impact of Data Density
🔒 Unlock Audio Lesson
Sign up and enroll to listen to this audio lesson
Finally, let’s talk about data density. How does the number of rain gauges affect our understanding of DAD relationships?
If there are fewer gauges, it might not accurately capture rainfall variability.
Exactly! Sparse data can lead to underestimations of rainfall depth. Why do you think this is important?
It can lead to poor flood management and design choices.
Exactly, we always aim to utilize adequate data to make accurate predictions. Any final thoughts on this?
More data means better decisions!
Great summary: Adequate data density is crucial for reliability in DAD relationships!
Introduction & Overview
Read summaries of the section's main ideas at different levels of detail.
Quick Overview
Standard
Several factors influence DAD relationships, including topography, storm type, seasonality, rainfall intensity, and data density. Understanding these factors is crucial for accurate rainfall estimations and effective flood management.
Detailed
Factors Affecting DAD Relationships
DAD relationships play a pivotal role in hydrologic analysis for estimating rainfall depth over varying areas and durations. Several factors impact these relationships:
Key Factors
- Topography: Different elevations and landforms, such as mountains, can create orographic effects, leading to variations in rainfall distribution. This means that areas with varied terrains may experience different rainfall depths even during the same storm event.
- Storm Type: The nature of the storm has a significant impact. Convective storms are typically localized and produce steeper DAD curves, while frontal or cyclonic storms tend to cover larger areas with more gradual rainfall distribution.
- Seasonality: The time of year significantly affects rainfall characteristics. For example, the intensity and spread of monsoon storms differ from those of post-monsoon cyclones, leading to varying DAD relationships.
- Rainfall Intensity: High-intensity storms that occur over short durations generally create sharper transitions in DAD curves compared to longer-duration storms with lower intensity.
- Data Density: The distribution and number of rain gauges across a region can affect the accuracy of DAD relationships. Sparse networks may underestimate the actual variability of rainfall depth across areas.
Understanding these factors is critical for accurate hydrologic design, flood estimation, and effective water resource management.
Youtube Videos

![WRE Module2 [PART01] - Runoff - Catchment area - Drainage basin - Watershed - Factors affecting](https://img.youtube.com/vi/sSjhYdJqqQ8/mqdefault.jpg)


Audio Book
Dive deep into the subject with an immersive audiobook experience.
Topography
Chapter 1 of 5
🔒 Unlock Audio Chapter
Sign up and enroll to access the full audio experience
Chapter Content
- Topography: Hilly or mountainous areas show more variation due to orographic effects.
Detailed Explanation
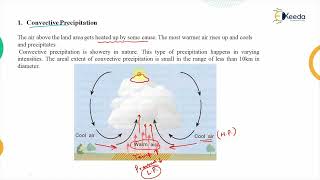
Topography refers to the physical features of a landscape, including its hills, valleys, and mountains. In areas with significant elevation changes (like mountains), rainfall can vary greatly. This variation happens due to orographic effects, where air rises over mountains, cools and condenses to form precipitation. Consequently, areas on the windward side of a mountain range often receive more rain than those on the leeward side, creating a non-uniform rainfall distribution across the landscape.
Examples & Analogies
Imagine standing on a mountain range where one side is drenched with rain, while the other side is dry. This is like using an umbrella in a rain shower; if you're underneath it, you get wet, but the other side remains dry, just like the areas influenced by mountains during a storm.
Storm Type
Chapter 2 of 5
🔒 Unlock Audio Chapter
Sign up and enroll to access the full audio experience
Chapter Content
- Storm type: Convective storms (localized) show steeper DAD curves than frontal or cyclonic storms (widespread).
Detailed Explanation
Storms can be classified based on their formation: convective storms form from the upward movement of warm, moist air, while frontal and cyclonic storms involve larger weather systems moving across regions. Convective storms often produce intense local rainfall over short periods, leading to steep DAD curves because rainfall depth changes dramatically with small changes in area. In contrast, frontal or cyclonic storms distribute rainfall more evenly over larger areas, resulting in gentler gradients in DAD relationships.
Examples & Analogies
Think of a sprinkler watering a small patch of grass (convective storm), where it sprays a lot of water in a concentrated area compared to a garden hose running along a whole row of plants (frontal storm), providing a steadier but less intense spray over a longer distance.
Seasonality
Chapter 3 of 5
🔒 Unlock Audio Chapter
Sign up and enroll to access the full audio experience
Chapter Content
- Seasonality: Monsoon storms may differ from post-monsoon cyclones in terms of spread and depth.
Detailed Explanation
The season plays a significant role in how storms behave. In monsoon seasons, storms are typically more consistent and widespread due to warm, moist air being continuously pumped into certain regions. Conversely, post-monsoon cyclones can bring heavy rain in a short duration but may not cover as large an area or may vary greatly in intensity. These seasonal differences affect how DAD relationships are applied depending on the time of year and the typical storm patterns.
Examples & Analogies
Consider a fruit tree that bears fruit at different times. During the peak season (monsoon), it produces a lot of fruits everywhere. After the peak, the occasional fruit might fall, but only from select branches (post-monsoon), highlighting how the quantity and distribution can vary depending on the season.
Rainfall Intensity
Chapter 4 of 5
🔒 Unlock Audio Chapter
Sign up and enroll to access the full audio experience
Chapter Content
- Rainfall intensity: High-intensity short-duration storms have sharper DAD gradients.
Detailed Explanation
When storms are intense but occur over a short period, they create sharp contrasts in rainfall depth across areas. These high-intensity storms can lead to sudden localized flooding as water accumulates quickly. The DAD curves for such storms rise steeply because small increases in area might reflect large decreases in rainfall depth compared to areas under the storm’s center.
Examples & Analogies
Think about a fire hose that is sprayed at full force onto a small target, which represents a high-intensity storm. If you were to aim it at a larger target, the pressure eases, and water is less concentrated—this is similar to how rainfall depth decreases as area increases during intense storms.
Data Density
Chapter 5 of 5
🔒 Unlock Audio Chapter
Sign up and enroll to access the full audio experience
Chapter Content
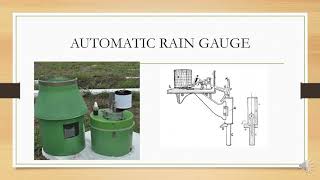
- Data density: Sparse gauge networks may underestimate the actual depth-area variability.
Detailed Explanation
Data density refers to how frequently rainfall data is collected across an area. If there are not enough rain gauge stations to capture storm data, certain extremes or variations in rainfall depth and area may be missed. This sparse data can lead to a misrepresentation of DAD relationships because there isn’t enough information to accurately analyze and predict rainfall patterns.
Examples & Analogies
Imagine trying to understand the temperature changes in a city by only taking readings from a few locations. If those readings are from only one side of the city, they might not represent the temperatures in other parts, just like sparse rain gauges fail to capture the varying depths of rainfall in different areas.
Key Concepts
-
Topography: Refers to the landscape features impacting rainfall variability.
-
Storm Type: Localized and widespread storms affect DAD relationships differently.
-
Seasonality: Different seasons change rainfall intensity and patterns.
-
Rainfall Intensity: Higher intensity storms create sharper gradients in DAD curves.
-
Data Density: The availability and placement of rain gauges can skew accuracy.
Examples & Applications
In mountainous regions, the western slopes receive significantly more rainfall due to orographic lift compared to eastern slopes.
During a convective summer storm, a city may receive two inches of rain in one hour, leading to flooding, while neighboring towns may receive much less.
Memory Aids
Interactive tools to help you remember key concepts
Rhymes
High hills lead to high thrills of rain, while flat lands make it plain.
Stories
Imagine a landscape where a mountain in the middle causes the clouds to pour rain only on one side. Meanwhile, the other side stays dry—like a squirrel thinking, 'Why is it always dry here?'
Memory Tools
Remember 'STIR' for the factors affecting DAD: Seasonality, Topography, Intensity, Rain gauge density.
Acronyms
'THIS' for understanding DAD elements
Type of storm
Height of terrain
Intensity of rainfall
and Spatial distribution of gauges.
Flash Cards
Glossary
- Topography
The physical features of a land surface including mountains, valleys, and plains.
- Orographic Effects
Rainfall variations due to topography, particularly when moisture is lifted over mountains.
- Convective Storms
Localized storms typically characterized by intense rainfall in a short period.
- Frontal Storms
Widespread storms associated with the movement of weather fronts.
- Data Density
The distribution and number of rain gauges available in a region to measure rainfall.
Reference links
Supplementary resources to enhance your learning experience.