
Use in Estimating Probable Maximum Precipitation (PMP)
Enroll to start learning
You’ve not yet enrolled in this course. Please enroll for free to listen to audio lessons, classroom podcasts and take practice test.
Interactive Audio Lesson
Listen to a student-teacher conversation explaining the topic in a relatable way.
Importance of DAD Curves in PMP Estimation
🔒 Unlock Audio Lesson
Sign up and enroll to listen to this audio lesson

Today, we'll explore how Depth-Area-Duration or DAD curves are essential for estimating the Probable Maximum Precipitation. Can anyone explain why we need to know PMP?

Is it because it helps with flood predictions?
Exactly! Knowing the PMP helps engineers design structures to withstand heavy rain and potential floods. Now, what do you think is the first step in estimating PMP using DAD curves?

Do we need to look at historical storms?
Yes! Selecting extreme historical storms is crucial. It helps inform our estimations. Remember, we're looking for the worst-case scenarios to ensure safety.
To aid memory: think of PMP as 'Prepare for Maximum Precipitation'. Can someone summarize our first key step?

We start by selecting the extreme storms!
Great recap! Let’s dive deeper into what we do with these storms next.
Maximizing Storm Input
🔒 Unlock Audio Lesson
Sign up and enroll to listen to this audio lesson

After selecting our storms, what do we do next?

Is it about transposing and maximizing them?
Exactly! We transpose the storms to fit the current area's characteristics and maximize them by analyzing available atmospheric moisture. Why do we maximize these storms?
To see the highest possible precipitation level?
That's correct! Higher precipitation levels help us determine the worst-case scenarios for planning. Think of this as our 'Moisture Maximization' process. Can anyone describe it briefly?
We adjust the storms for our area and look at the highest rainfall potential.
Perfect! Let's carry that understanding into how we can use DAD curves next.
Calculating PMP Using DAD Curves
🔒 Unlock Audio Lesson
Sign up and enroll to listen to this audio lesson
Now, once we have our maximized storms, how do we apply this to our DAD curves?
We use them to find the spatial distribution of the PMP?
Exactly! DAD curves help us to illustrate how precipitation varies across different areas. This is critical in understanding flood zones. Can anyone explain why spatial distribution is vital?
So we can prepare different areas for the varying impact of storms?
Right! By understanding where PMP is likely highest, we can target our flood control efforts effectively. Remember the key idea: 'Distribute for Safety'! How do we summarize this?
DAD curves help find where PMP falls across areas!
Well said! Let’s see how we implement this in hydrologic models next.
Implementing PMP in Hydrologic Models
🔒 Unlock Audio Lesson
Sign up and enroll to listen to this audio lesson
After determining the spatial distribution of PMP, what’s our next step in hydrologic modeling?
We apply the PMP to hydrologic models to estimate potential floods?
Correct! This input allows us to predict the Probable Maximum Flood or PMF. Why do you think understanding PMF is crucial for engineering?
It helps design defenses like dams and reservoirs, right?
Spot on! Engineers depend on these models to ensure public safety. Let's make this memorable: think 'PMP to PMF, Protecting Maximum Future'. How do we summarize our full process?
We analyze storms, maximize data, use DAD curves, then feed it into models for flood predictions.
Exactly! That is the complete cycle. Well done, everyone!
Introduction & Overview
Read summaries of the section's main ideas at different levels of detail.
Quick Overview
Standard
In estimating Probable Maximum Precipitation (PMP), DAD curves are key tools that help analyze extreme historical storms and their spatial distribution. This process includes selecting historical storms, maximizing them through moisture maximization methods, and applying the resultant PMP data to hydrologic models for Probable Maximum Flood (PMF) estimation.
Detailed
Use in Estimating Probable Maximum Precipitation (PMP)
DAD curves play a crucial role in hydrologic analysis, specifically in the estimation of Probable Maximum Precipitation (PMP), which is essential for flood risk assessment and infrastructure design. This section outlines the systematic process in using DAD relationships for PMP estimation:
- Selecting Extreme Historical Storms: The first step involves identifying historical storm events that represent the extreme limits of rainfall for a given area. Historical data ensures that the storms analyzed are relevant and reflective of possible worst-case scenarios.
- Transposing and Maximizing the Storm: After selecting the extreme storms, these events are transposed geographically and maximized by considering moisture inputs available in the atmosphere at that time, thereby enhancing the potential precipitation levels.
- Using DAD Curves for Spatial Distribution: With the maximized storm data, DAD curves are applied to estimate how PMP varies across different spatial extents. This variability is crucial for effectively planning and designing structures that manage flood risks.
- Applying PMP to Hydrologic Models: The final step involves inputting the estimated PMP values into hydrologic models, which are used to predict the resulting Probable Maximum Flood (PMF). This is vital for designing infrastructure like dams and reservoirs to withstand these extreme flood events.
In summary, DAD curves facilitate a structured approach to estimating PMP, which is instrumental in enhancing flood management strategies.
Youtube Videos

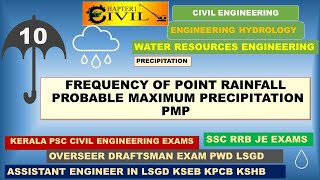


![WRE Module1 [PART10] - Design Rainfall, Probable Maximum Precipitation, Recurrence interval](https://img.youtube.com/vi/REJfs9yHbiU/mqdefault.jpg)
Audio Book
Dive deep into the subject with an immersive audiobook experience.
Importance of DAD Curves in PMP Estimation
Chapter 1 of 2
🔒 Unlock Audio Chapter
Sign up and enroll to access the full audio experience
Chapter Content
DAD curves are particularly important in PMP estimation. The steps include:
Detailed Explanation
This chunk highlights the central role that Depth-Area-Duration (DAD) curves play in estimating Probable Maximum Precipitation (PMP). It indicates that these curves guide us in understanding rainfall distribution over various areas and durations, which is critical for predicting extreme rainfall events.
The next part of the chunk outlines the sequential steps involved in this estimation process.
Examples & Analogies
Imagine planning an outdoor event. You check the weather not just for your town, but also for the neighboring areas. By doing so, you get a better sense of whether rain will affect your event. Similarly, DAD curves help hydrologists evaluate not only the rainfall at a point but also how it might spread over a larger region during extreme weather events.
Steps for PMP Estimation Using DAD Curves
Chapter 2 of 2
🔒 Unlock Audio Chapter
Sign up and enroll to access the full audio experience
Chapter Content
• Selecting extreme historical storms.
• Transposing and maximizing the storm by moisture maximization.
• Using DAD curves to find spatial distribution of PMP.
• Applying PMP to hydrologic models to estimate PMF.
Detailed Explanation
This chunk lists the specific steps taken to estimate PMP using DAD curves:
1. Selecting extreme historical storms: First, we identify past storms that delivered extreme rainfall. These storms are our benchmarks for understanding potential maximum precipitation.
2. Transposing and maximizing the storm: This involves adjusting the characteristics of selected storms to maximize the moisture. Essentially, we estimate what might happen if these storms had access to even more moisture, producing higher rainfall amounts.
3. Using DAD curves: Once we have our extreme storm profiles, we apply DAD curves to gauge how this maximum precipitation would distribute over a given area.
4. Applying PMP to hydrologic models: Finally, this estimated rainfall is inputted into models that simulate water flow and flooding (known as Probable Maximum Flood or PMF), ensuring that urban planning and infrastructure can withstand such extreme events.
Examples & Analogies
Think of preparing for the worst-case scenario in a safety drill. You examine what has happened in past emergencies, adjust your training scenarios to include more challenging situations (like more people or equipment), and then apply those lessons to your current plans. This methodical approach ensures that you're thoroughly prepared for extreme conditions, just like how engineers prepare for future storms using historical data.
Key Concepts
-
Depth-Area-Duration (DAD) Curves: Essential for estimating rainfall distribution and understanding flood potential.
-
Probable Maximum Precipitation (PMP): The highest precipitation anticipated, which helps in flood risk assessment.
-
Moisture Maximization: The process of involving maximum moisture data available for storm analysis.
-
Probable Maximum Flood (PMF): The potential flooding that could result from the PMP event, pivotal for infrastructure design.
Examples & Applications
When analyzing the potential impact of a cyclone, engineers might use historical storm data from previous cyclones to estimate the PMP, ensuring that dams can handle future extreme events.
If a region experiences localized convection storms, the DAD curves help to predict how much rain will fall in specific areas and timings, informing flood preparedness.
Memory Aids
Interactive tools to help you remember key concepts
Rhymes
PMP is what we seek, in floods it's not for the weak.
Stories
Imagine a town preparing for the worst storm. They look back at past events, maximizing every drop of rain to create a safety net that keeps everyone dry!
Memory Tools
To remember the PMP process: 'Select, Maximize, Distribute, Apply' - SMDA
Acronyms
MMP
Maximize Moisture Potential.
Flash Cards
Glossary
- Probable Maximum Precipitation (PMP)
The maximum amount of precipitation that could occur under the most severe weather conditions at a specific location.
- DepthAreaDuration (DAD) curves
A graphical representation that shows the relationship between the depth of precipitation, the area over which it falls, and the duration of the storm.
- Transposing
The process of adapting storm data to fit different geographic areas.
- Moisture Maximization
A method used to enhance storm data by considering the maximum available moisture in the atmosphere.
- Probable Maximum Flood (PMF)
The estimated maximum flood that could occur as a result of the maximum precipitation event.
Reference links
Supplementary resources to enhance your learning experience.