
Graphical Interpretation of Convolution
Enroll to start learning
You’ve not yet enrolled in this course. Please enroll for free to listen to audio lessons, classroom podcasts and take practice test.
Interactive Audio Lesson
Listen to a student-teacher conversation explaining the topic in a relatable way.
Introduction to Graphical Convolution
🔒 Unlock Audio Lesson
Sign up and enroll to listen to this audio lesson

Today, we’ll focus on how to interpret convolution graphically. Can anyone remind me what convolution does in simple terms?

Isn't convolution about combining two functions to see how one affects the other over time?
Exactly! It blends two functions to illustrate their interaction. Now, let's visualize that. What will happen if we flip one of the functions?

We get the function mirrored, right? It allows us to see how the shapes interact.
Yes! Flipping is an essential step. Remember, we will then shift it to analyze how it influences the other function over intervals.
Steps in Graphical Computation
🔒 Unlock Audio Lesson
Sign up and enroll to listen to this audio lesson

Let's get into the steps to graphically compute convolution. Who remembers the first step?

We flip g(τ) to get g(-τ).
Right! Then we shift g(-τ) by t to get g(t-τ). What comes next?

We multiply f(τ) and g(t-τ) for all τ in the range.
Correct! Finally, we integrate the product over the specified interval. This process shows how the effects overlap at different times.
Real-Life Applications in Civil Engineering
🔒 Unlock Audio Lesson
Sign up and enroll to listen to this audio lesson
Now that we've learned the process, how do we see this in civil engineering?
In structural analysis, it helps determine how forces affect a building over time.
Right! For instance, during an earthquake, knowing how loads shift can guide engineers in design. Anyone else?
Also in finite element analysis, we can model response functions for comprehensive solutions.
Exactly! This graphical understanding of convolution is critical in dynamic evaluations.
Review of Graphical Convolution
🔒 Unlock Audio Lesson
Sign up and enroll to listen to this audio lesson
So let's recap. What are the main takeaways about graphical convolution?
We learned how to compute it step by step, starting with flipping and shifting.
And it’s crucial for understanding system responses in engineering!
Exactly! Remember these steps and their applications as we move forward in our studies.
Introduction & Overview
Read summaries of the section's main ideas at different levels of detail.
Quick Overview
Standard
In this section, readers gain insights into the graphical computation of convolution. The step-by-step methodology allows for a visual appreciation of how the convolution of two functions operates, which is particularly useful for engineering applications such as structural load analysis. The discussion also highlights the significance of visual representation in understanding the influence of one function over another across time.
Detailed
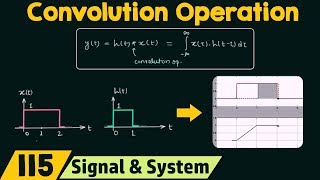
Graphical Interpretation of Convolution
In engineering, particularly within the Civil Engineering realm, understanding convolution through a graphical lens is pivotal. This section revolves around how to compute convolution graphically and its implications for system behavior interpretation.
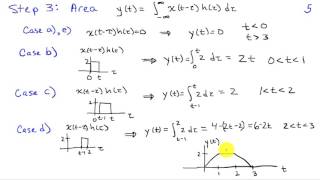
Steps to Graphically Compute Convolution
- Flip g(τ): The first step involves flipping the function g over the vertical axis to generate g(-τ).
- Shift g(−τ): Next, shift this flipped function to the right by time t, resulting in g(t-τ).
- Multiply: For every τ within the interval [0, t], multiply the original function f(τ) and the shifted function g(t-τ).
- Integrate: Finally, integrate this product from 0 to t. This process effectively “slides” g over f and captures the effects at each point in time.
Applications in Civil Engineering Contexts
- Structural Load Analysis: This graphical interpretation is essential for observing how a force applied at one time affects the structure at a later time.
- Finite Element Analysis (FEA): Convolution can be visually interpreted through impulse response functions to build comprehensive solutions across time.
The graphical approach not only enhances the comprehension of convolution but also assists in the practical application of this mathematical concept in engineering scenarios.
Youtube Videos


Audio Book
Dive deep into the subject with an immersive audiobook experience.
Use in Civil Engineering Contexts
Chapter 1 of 1
🔒 Unlock Audio Chapter
Sign up and enroll to access the full audio experience
Chapter Content
• For time-dependent structural load analysis, convolution can visually represent how a force applied at one point in time influences the system at another.
• In Finite Element Analysis (FEA), convolution allows the use of impulse response functions to build the full solution over time.
Detailed Explanation
This chunk highlights the practical applications of convolution in civil engineering. In time-dependent structural load analysis, engineers can use convolution to understand how forces applied to structures at specific times affect the overall response of those structures at later times. For instance, if a building experiences a sudden load from an earthquake, convolution can help engineers predict how this load will influence the building's behavior over time. Likewise, in Finite Element Analysis (FEA), convolution is essential for incorporating impulse response functions, which characterize how a system reacts to immediate forces over time, allowing for the precise modeling of structural responses in various scenarios.
Examples & Analogies
Think of a trampoline. When you jump on a trampoline (applying a load), it doesn't just instantly return to its original shape. Instead, its bouncing motion changes based on the timing and intensity of your jump and how the trampoline is constructed. Using convolution, engineers can predict how the trampoline will respond not only during your jump but also as it settles back down after you're finished. This analogy helps visualize the concept of time-dependent responses in civil structures.
Key Concepts
-
Graphical Convolution: A visual method of computing the convolution of two functions by flipping, shifting, and multiplying.
-
Impulse Response: Used in convolution to analyze how systems respond to inputs.
-
Integration in Convolution: Essential for summing overlapping areas of the functions.
Examples & Applications
Visualizing how applying a force at one point in time influences structural response later through graphical convolution.
Using graphical convolution to analyze how temperature changes affect material stress in structural engineering.
Memory Aids
Interactive tools to help you remember key concepts
Rhymes
Flip it, shift it, then we can see, how two functions multiply and integrate with glee!
Stories
Imagine two rivers (functions) merging that flow over time; see how they overlap and create unique shapes.
Memory Tools
F-S-M-I: Flip, Shift, Multiply, Integrate. Remember the order of steps!
Acronyms
FMI - Flip, Multiply, Integrate! The three crucial steps to remember for convolution.
Flash Cards
Glossary
- Convolution
A mathematical operation that combines two functions to produce a third function, representing how the shape of one is modified by the other.
- Impulse Response
The output of a system when presented with a brief input signal at time zero; pivotal in convolution interpretations.
- Integration
A fundamental mathematical operation that computes the area under a curve; used in convolution for summing overlapping parts.
- Shift
To move a function along the time axis, which is essential in convolution to assess how one function affects another over time.
- Signal Processing
The analysis, interpretation, and manipulation of signals, where convolution is extensively applied.
Reference links
Supplementary resources to enhance your learning experience.