
Assumed Mean Method - 5.2.1.1.2
Enroll to start learning
You’ve not yet enrolled in this course. Please enroll for free to listen to audio lessons, classroom podcasts and take practice test.
Interactive Audio Lesson
Listen to a student-teacher conversation explaining the topic in a relatable way.
Introduction to the Assumed Mean Method
🔒 Unlock Audio Lesson
Sign up and enroll to listen to this audio lesson

Welcome everyone! Today, we're exploring the Assumed Mean Method. Can anyone tell me why we might need this method?

Maybe it's for large datasets where calculating the mean directly is hard?
Exactly! When dealing with large observations, direct calculation can get tricky. The Assumed Mean Method simplifies this process. Let’s break down how it works.
Choosing an Assumed Mean
🔒 Unlock Audio Lesson
Sign up and enroll to listen to this audio lesson

The first step in our method is to choose an assumed mean. This value should be close to what we expect. Can anyone share how we might select this figure?

Could we use the average of a smaller sample as a guide?
That's a good approach! We use our knowledge or past experience. After we have our assumed mean, what do we do next?

We calculate deviations from that mean!
Correct! Let’s see how we find these deviations.
Calculating Deviations
🔒 Unlock Audio Lesson
Sign up and enroll to listen to this audio lesson
Once we have our assumed mean, we calculate the deviation of each observation. For instance, if our assumed mean is 100, and our first observation is 90, what’s the deviation?

It would be -10, right? Because 90 is less than 100?
Perfect! We subtract the assumed mean from each observation. By summing these deviations, we can streamline the process of finding the actual mean. What’s the next step after summation?
We divide by the total number of observations?
Yes! And then we add this to our assumed mean to get our final average. Let’s try an example together!
Practical Example
🔒 Unlock Audio Lesson
Sign up and enroll to listen to this audio lesson
Let’s say we have the weekly incomes of families: 850, 700, 5000, 80, 420, and 400. If we assume 850 as our mean. Can anyone calculate the deviations?
For 700, it would be -150. For 5000, it’s +4150, and so on.
Exactly! What do we do with these deviations?
We add them up and divide by the total number of families!
Great! And finally, what’s the last step?
We add this value to our assumed mean to get the actual mean!
Step Deviation Method
🔒 Unlock Audio Lesson
Sign up and enroll to listen to this audio lesson
There’s an even more efficient way if the calculations involve larger numbers: the Step Deviation Method! How might this differ from what we just discussed?
Do we divide by a common factor?
Exactly! Instead of using direct deviations, we divide the deviations by a common factor to avoid large numbers. This helps simplify calculations!
So we multiply the result by this factor when we add it to the assumed mean?
Exactly that! Now, who can recap the importance of the Assumed Mean Method?
It simplifies calculations for large data, making it efficient and less time-consuming!
Introduction & Overview
Read summaries of the section's main ideas at different levels of detail.
Quick Overview
Standard
The Assumed Mean Method is a statistical technique for estimating the arithmetic mean of a dataset with large numbers and large observations, enhancing the efficiency of calculation. It involves choosing an assumed mean, calculating deviations, and using these to compute the actual mean more easily.
Detailed
Assumed Mean Method
In this section, we delve into the Assumed Mean Method, an approach used to compute the arithmetic mean when dealing with a substantial number of observations or when large figures complicate direct calculations. The method simplifies the process by allowing one to start with an assumed value that is close to the expected mean and calculating deviations from this assumed mean.
Key Concepts:
- Assumed Mean: A figure chosen based on logic or experience, serving as a starting point for calculations.
- Deviations: These are calculated as the difference between each observation and the assumed mean.
- Summation of Deviations: The total of all deviations is taken, which ultimately allows for the calculation of the actual mean via a simplified equation.
Example**: For instance, if we have family incomes of certain families, instead of calculating directly, you might assume a figure, compute deviations, and derive the mean efficiently, thus saving time in data analysis.
This method is particularly beneficial in contexts where datasets are extensive, ensuring that we maintain accuracy without excessive computation efforts.
Youtube Videos


Audio Book
Dive deep into the subject with an immersive audiobook experience.
Introduction to the Assumed Mean Method
Chapter 1 of 4
🔒 Unlock Audio Chapter
Sign up and enroll to access the full audio experience
Chapter Content
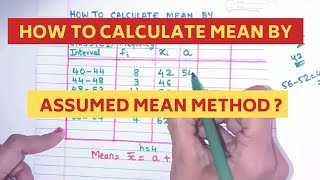
If the number of observations in the data is more and/or figures are large, it is difficult to compute arithmetic mean by direct method. The computation can be made easier by assumed mean method.
Detailed Explanation
The Assumed Mean Method is particularly useful when dealing with large datasets or when the numbers involved are very high. In such cases, calculating the arithmetic mean directly can be cumbersome and time-consuming. By assuming an initial figure as the mean, we simplify the calculations significantly. This approach allows us to work with deviations from the assumed mean, which can make the arithmetic mean estimation much more manageable.
Examples & Analogies
Imagine you are trying to calculate the average score of a soccer team over a whole season, but you have data from many games, and the scores are hefty. Instead of adding all those scores directly, you decide to use a typical score (like the average score you've noted from a few games) as a reference point. From there, you calculate how each game's score differs from this typical score, which simplifies the process of finding the average at the end.
Calculating the Arithmetic Mean Using the Assumed Mean Method
Chapter 2 of 4
🔒 Unlock Audio Chapter
Sign up and enroll to access the full audio experience
Chapter Content
In order to save time in calculating mean from a data set containing a large number of observations as well as large numerical figures, you can use assumed mean method.
Detailed Explanation
To perform calculations using the Assumed Mean Method, you begin by selecting a number to act as your 'assumed mean.' Then, you calculate the deviations of all data points from this assumed mean. These deviations are then summed up, and a relation involving the total number of observations and the average of the deviations is established. Finally, to find the actual arithmetic mean, you add the total of the deviations divided by the number of observations to your assumed mean.
Examples & Analogies
Consider a scenario where a teacher wants to calculate the average score of a class from a large set of exam scores. Instead of calculating directly, the teacher rolls with an assumed average of 70. After determining how each student's score deviates from this 70, summing these deviations tells her how far off, on average, she is from the actual average score. This method speeds up her calculation rather than adding all scores directly.
Step Deviation Method
Chapter 3 of 4
🔒 Unlock Audio Chapter
Sign up and enroll to access the full audio experience
Chapter Content
The calculations can be further simplified by dividing all the deviations taken from assumed mean by the common factor ‘c’. The objective is to avoid large numerical figures.
Detailed Explanation
The Step Deviation Method refines the Assumed Mean Method even further. By introducing a common factor 'c' to simplify the deviations, we reduce the size of the numbers we are working with, making calculations easier. This method is particularly effective when deviations are large. By reducing these numbers, you not only simplify the math but also minimize potential computational errors.
Examples & Analogies
Think of how a chef might simplify a recipe. If a recipe calls for 100 grams of salt, it may be more cumbersome to measure than just using '1 part' of salt compared to other ingredients. Here, that '1 part' serves like our common factor, making the entire cooking process quicker and simpler to grasp.
Example Calculations
Chapter 4 of 4
🔒 Unlock Audio Chapter
Sign up and enroll to access the full audio experience
Chapter Content
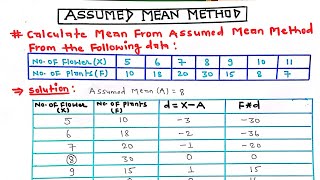
Using assumed mean method examples to determine the mean family income through individual and grouped data.
Detailed Explanation
In practice, using the Assumed Mean Method involves specifying your assumed mean and then systematically calculating all the required deviations from this mean. By summarizing these deviations, a clearer picture of the overall data can emerge. Additionally, when you have frequency data (like the number of families in each income group), you can apply the same logic by treating class midpoints like individual observations in a direct mean calculation.
Examples & Analogies
Imagine you are a financial analyst looking at income distribution across different neighborhoods in a city. Instead of manually calculating the average income for each neighborhood, you set an assumed average of $50,000 based on your prior experience and calculate how each household's income varies from this. You can quickly determine income disparities and averages without tedious recalibrations.
Key Concepts
-
Assumed Mean: A figure chosen based on logic or experience, serving as a starting point for calculations.
-
Deviations: These are calculated as the difference between each observation and the assumed mean.
-
Summation of Deviations: The total of all deviations is taken, which ultimately allows for the calculation of the actual mean via a simplified equation.
-
Example**: For instance, if we have family incomes of certain families, instead of calculating directly, you might assume a figure, compute deviations, and derive the mean efficiently, thus saving time in data analysis.
-
This method is particularly beneficial in contexts where datasets are extensive, ensuring that we maintain accuracy without excessive computation efforts.
Examples & Applications
Example of calculating weekly income with assumed mean chosen for simplified computations.
Example of the Step Deviation Method applied to large datasets.
Memory Aids
Interactive tools to help you remember key concepts
Rhymes
When numbers are high and time is tight, assume a mean to get it right!
Stories
Imagine a farmer like Baiju who estimates his crops' earnings using an assumed value to make his financial math easier, ensuring he can compare with other farmers.
Memory Tools
AD-SUM: Assume, Deviate, Sum Up Mean - for the Assumed Mean Method.
Acronyms
A-M-D
Assumed Mean
Deviation for simplifying calculations.
Flash Cards
Glossary
- Assumed Mean
A hypothesized value taken to simplify the calculation of the arithmetic mean.
- Deviation
The difference between each observation and the assumed mean.
- Summation of Deviations
The total sum of all deviations calculated to find the actual arithmetic mean.
Reference links
Supplementary resources to enhance your learning experience.