
Continuous Series - 5.3.3
Enroll to start learning
You’ve not yet enrolled in this course. Please enroll for free to listen to audio lessons, classroom podcasts and take practice test.
Interactive Audio Lesson
Listen to a student-teacher conversation explaining the topic in a relatable way.
Understanding Continuous Series
🔒 Unlock Audio Lesson
Sign up and enroll to listen to this audio lesson

Today, we’re diving into continuous series. Can anyone tell me what a continuous series actually is?

Isn't it a series with ranges of data instead of just single values?
Exactly, great point! In continuous series, we deal with intervals like wages, ages, or temperatures. Now, why do you think it’s useful to work with ranges?

It helps us analyze large datasets without focusing on every single data point.
Absolutely! It simplifies our work. Let’s move on to how we find the median in a continuous series.
Finding the Median Class
🔒 Unlock Audio Lesson
Sign up and enroll to listen to this audio lesson

To find the median of a continuous series, we first need to identify the median class. This involves calculating N/2. Can someone explain what N represents?

N represents the total number of items in the dataset, right?
Correct! So, once we have N, we can find our N/2th item in the cumulative frequency table. Any questions so far?

What if the frequencies are not the same for all intervals?
Good question! The beauty of this method is that no adjustment is needed even if the frequencies vary. Let's practice using an example.
Applying the Median Formula
🔒 Unlock Audio Lesson
Sign up and enroll to listen to this audio lesson
Now, let’s apply the median formula. Can anyone recall what the formula looks like?
Median = L + [(N/2 – c.f.) / f] × h?
Right on target! Where does L stand for? Let’s break that down.
L is the lower limit of the median class!
Yes! And c.f. is the cumulative frequency of the class before the median class. Why is it important to include this in the formula?
It helps us adjust relative to the total frequency!
Spot on! Great involvement, everyone.
Example Calculation of Median Daily Wage
🔒 Unlock Audio Lesson
Sign up and enroll to listen to this audio lesson
Let’s look at an example of daily wages to compute the median. We have wage intervals and worker counts. Can someone summarize the first step?
We first need to find N, the total number of workers!
Correct! After calculating N, we identify the median class using N/2. Which class do we find next?
The 35-40 class will be our median class since it contains the 80th worker!
Exactly! Now plug everything into our formula to get the median wage. Could someone calculate it based on our earlier discussions?
After all calculations, we end up with Rs 35.83?
Perfect calculation! This shows how half the workers earn less than or equal to Rs 35.83. Great job everyone!
Introduction & Overview
Read summaries of the section's main ideas at different levels of detail.
Quick Overview
Standard
This section outlines the method for calculating the median in a continuous series, including the importance of identifying the median class and employing the formula. It presents an illustrative example with data on daily wages to solidify the understanding of the topic.
Detailed
Continuous Series
In statistical analysis, a continuous series is a dataset with ranges or intervals of values rather than discrete individual values. To find the median in such a series, you begin by determining the median class, which includes the N/2th item. The formula for calculating the median is derived from the lower limit of the median class, the cumulative frequency of the preceding class, the frequency of the median class, and the height of the median interval. This section emphasizes that no adjustments are necessary for unequal frequencies. An example illustrating daily wages in a factory demonstrates how to compute the median, showing that 50% of the workers earn less than or equal to the calculated median wage.
Youtube Videos


Audio Book
Dive deep into the subject with an immersive audiobook experience.
Finding the Median Class
Chapter 1 of 6
🔒 Unlock Audio Chapter
Sign up and enroll to access the full audio experience
Chapter Content
In case of continuous series you have to locate the median class where N/2th item [not (N+1)/2th item] lies.
Detailed Explanation
To find the median in a continuous series, you first need to determine the median class. This is done by calculating N/2, where N represents the total number of observations. Instead of using (N+1)/2, the focus is solely on N/2, which gives the position of the median in the ordered dataset.
Examples & Analogies
Imagine you have a list of all the ages in a large family. To find the age that divides the family into two equal parts (half younger and half older), you don't add one to the total number of family members; you simply divide the total by two.
Calculating the Median
Chapter 2 of 6
🔒 Unlock Audio Chapter
Sign up and enroll to access the full audio experience
Chapter Content
The median can then be obtained as follows: Median =
Where, L = lower limit of the median class,
c.f. = cumulative frequency of the class preceding the median class,
f = frequency of the median class,
h = magnitude of the median class interval.
Detailed Explanation
Once you've identified the median class, you can calculate the median using a specific formula. Here, L is the lower limit of the median class interval, c.f. is the cumulative frequency of the class immediately before the median class, f is the number of observations in the median class, and h is the width of the median class interval. This formula helps compute the median accurately based on the distribution of data.
Examples & Analogies
Think of making a fruit salad with a variety of fruits grouped by type. If you want to find out which fruit divides the group into two equal parts, you need to know how many of each type you have (frequency), the cutoff (lower limit), and the typical size of these fruit groups (interval width).
No Adjustment for Unequal Frequencies
Chapter 3 of 6
🔒 Unlock Audio Chapter
Sign up and enroll to access the full audio experience
Chapter Content
No adjustment is required if frequency is of unequal size or magnitude.
Detailed Explanation
In a continuous series, even if the frequency of each class interval is not the same (i.e., the number of observations varies), you can still use the median formula directly without making any adjustments. The methodology remains consistent regardless of how the data is distributed across different intervals.
Examples & Analogies
Imagine you have a class of students where some groups are larger than others during a group project. When assessing the performance (median grade), you still look at the groups as they are without trying to adjust their sizes to make them equal, because each group's size gives insights into their contribution.
Example of Computing Median
Chapter 4 of 6
🔒 Unlock Audio Chapter
Sign up and enroll to access the full audio experience
Chapter Content
Example 8 Following data relates to daily wages of persons working in a factory. Compute the median daily wage. Daily wages (in Rs): 55–60 50–55 45–50 40–45 35–40 30–35 25–30 20–25 Number of workers: 7 13 15 20 30 33 28 14 The data is arranged in descending order here.
Detailed Explanation
In this example, the daily wages are presented in ranges along with the number of workers in each wage interval. By first calculating the total number of workers (N), which is 160, we can find the median class by identifying the interval where the 80th worker lies, which in this case is the 35–40 Rs class. The cumulative frequency table helps us in this identification as we add the number of workers progressively.
Examples & Analogies
Consider an elevator in a building where each floor represents a different wage range. As workers enter the elevator and go to their respective floors, counting them reveals how many occupy each floor, and finding the middle floor tells us about the middle wage earner.
Result Interpretation
Chapter 5 of 6
🔒 Unlock Audio Chapter
Sign up and enroll to access the full audio experience
Chapter Content
Thus, the median daily wage is Rs 35.83. This means that 50% of the workers are getting less than or equal to Rs 35.83 and 50% of the workers are getting more than or equal to this wage.
Detailed Explanation
The computed median daily wage of Rs 35.83 indicates that out of all workers, half earn below this amount and half earn above it. This measure provides insight into the earnings distribution among workers, highlighting what is typical or common earners in this dataset.
Examples & Analogies
Think of the median wage like the middle score in a sports game. If half the players score below this score, it shows the performance level is consistent at this point, while the higher-scoring players represent those exceeding the average.
Understanding the Median as Central Tendency
Chapter 6 of 6
🔒 Unlock Audio Chapter
Sign up and enroll to access the full audio experience
Chapter Content
You should remember that median, as a measure of central tendency, is not sensitive to all the values in the series. It concentrates on the values of the central items of the data.
Detailed Explanation
The median is a type of average that provides a measure of central tendency by focusing solely on the middle value of a dataset. It does not get influenced by extreme values (outliers), which can skew the mean (average). This makes the median a reliable measure for understanding typical data points, especially in skewed distributions.
Examples & Analogies
If you consider test scores for a class where most scored around 70 but one student scored 0, the mean might drag down to 50. However, the median score will still reflect that middle point of 70, showing a more accurate representation of student performance.
Key Concepts
-
Continuous Series: Data represented within intervals.
-
Median Class: The specific class in which the median falls.
-
N/2 Calculation: Used for identifying the median class.
-
Cumulative Frequency: Supports the median calculation by summing frequencies.
-
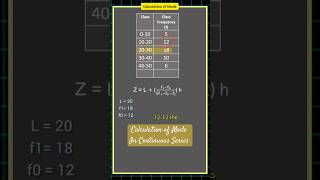
Median Formula: L + [(N/2 – c.f.) / f] × h to find the median.
Examples & Applications
Example of calculating median using a continuous series of daily wages.
Illustration of cumulative frequency in interpreting a frequency distribution table.
Memory Aids
Interactive tools to help you remember key concepts
Rhymes
In continuous series, to find the median, look for the class, don’t forget your canon!
Stories
Imagine a factory where workers earn wages in bands, to find the median wage, we look at the upper strands!
Memory Tools
Use 'CLFh' for calculating the median: Class Limit, Frequency before, Frequency of class, magnitude height.
Acronyms
Remember CFM, for Continuous Frequency Median
Cumulative frequency helps find median!
Flash Cards
Glossary
- Continuous Series
A data series where values are represented within intervals rather than distinct single points.
- Median Class
The class interval that contains the median value of a continuous data set.
- N/2
Half of the total number of items in a dataset, used to locate the median class.
- Cumulative Frequency
The total frequency of all classes up to and including the current class.
- Lower Limit (L)
The smallest value in a class interval used to calculate median.
- Frequency (f)
The number of occurrences of a value or range of values within a dataset.
- Magnitude (h)
The size or span of the class interval in a continuous series.
Reference links
Supplementary resources to enhance your learning experience.