
Calculation of arithmetic mean for Grouped data
Enroll to start learning
You’ve not yet enrolled in this course. Please enroll for free to listen to audio lessons, classroom podcasts and take practice test.
Interactive Audio Lesson
Listen to a student-teacher conversation explaining the topic in a relatable way.
Introduction to Arithmetic Mean
🔒 Unlock Audio Lesson
Sign up and enroll to listen to this audio lesson

Good morning, class! Today, we are going to learn about the arithmetic mean, particularly how to calculate it for grouped data. Who can tell me what the arithmetic mean is?

It’s the average of a set of values, right?
Exactly! The arithmetic mean is the sum of all observations divided by the number of observations. For grouped data, we need to slightly modify our approach. Do you know why?

Because we have to work with categories instead of individual values?
Correct! Since we group data, we use mid-values for calculations. Let’s remember the term 'mid-point' as it’s vital here. Can anyone tell me how we find the purpose of calculating these averages?

To better understand trends and economic conditions?
Yes, that's right! We'll also see specific methods to calculate these means efficiently.
Direct Method for Discrete Series
🔒 Unlock Audio Lesson
Sign up and enroll to listen to this audio lesson

Let’s discuss the Direct Method for calculating the arithmetic mean of a discrete series. Can someone explain how we apply this?
We multiply each class frequency by its mid-point and sum these products.
Precisely! And what do we do next?
We divide the total by the sum of the frequencies, right?
Spot on! Now for a quick memory aid: 'F-M-S', which stands for Frequency, Mid-point, Sum. This can help you remember the process!
Can you give an example of this method?
Of course! If our data showed income levels of a community categorized by ranges, we would calculate the mean income using these methods.
Assumed Mean Method
🔒 Unlock Audio Lesson
Sign up and enroll to listen to this audio lesson
Now let’s explore the Assumed Mean Method. What do you think is the benefit of this method?
It makes calculations easier, especially with large numbers, right?
Exactly! By choosing an assumed mean, we can reduce complexity. What would be the first step in this method?

We'll assume a mean and calculate deviations from it?
Well done! Remember, what we’re doing is using these deviations to find an accurate estimated mean by adjusting the assumed value. Lastly, can anyone summarize the steps we mentioned?
Assume a mean, find deviations, sum them, divide by total frequencies, and add this to the assumed mean!
Introduction & Overview
Read summaries of the section's main ideas at different levels of detail.
Quick Overview
Standard
In this section, various methods to calculate the arithmetic mean for grouped data are outlined. It elaborates on the Direct Method and introduces the Assumed Mean Method for simplifying calculations in cases of larger data sets, emphasizing the importance of understanding how to handle grouped data effectively.
Detailed
Calculation of Arithmetic Mean for Grouped Data
This section focuses on how to calculate the arithmetic mean for grouped data, which aggregates smaller data sets into larger groups for easier analysis. The arithmetic mean, a measure of central tendency, is typically computed as the sum of all values divided by the number of observations. The methodologies discussed include:
- Direct Method: This involves summing the products of the frequency of each observation and the corresponding values, then dividing this sum by the total frequency.
- Assumed Mean Method: This method simplifies calculations, especially with larger data sets. An arbitrary value (assumed mean) is chosen based on insight or experience, from which deviations are calculated. These deviations, when summed and adjusted, provide a quick way to approximate the mean.
The importance of this calculation is not limited to individual data points but extends to evaluating economic conditions and making informed decisions based on statistical analysis. The section also distinguishes between discrete and continuous series and elaborates on using mid-points for continuous data. Further, it covers rules and formulas for determining mean, as well as methods to calculate it effectively, making it highly relevant in fields of statistics and economics.
Youtube Videos


Audio Book
Dive deep into the subject with an immersive audiobook experience.
Introduction to Arithmetic Mean for Grouped Data
Chapter 1 of 4
🔒 Unlock Audio Chapter
Sign up and enroll to access the full audio experience
Chapter Content
The calculation of arithmetic mean can be studied under two broad categories: 1. Arithmetic Mean for Ungrouped Data. 2. Arithmetic Mean for Grouped Data.
Detailed Explanation
The arithmetic mean is a way to find the typical value of a dataset. It can be calculated for ungrouped data, where all individual values are considered, and for grouped data, where values are organized into intervals or categories. In this section, we will focus on how to calculate the arithmetic mean specifically for grouped data.
Examples & Analogies
Imagine a teacher wants to find the average score of a class on an exam. If she has individual scores (ungrouped data), she simply adds all scores and divides by the number of students. However, if she has scores grouped into ranges (like 0-10, 11-20), she will use a different approach to find the average of these groups.
Calculating Arithmetic Mean for Discrete Series
Chapter 2 of 4
🔒 Unlock Audio Chapter
Sign up and enroll to access the full audio experience
Chapter Content
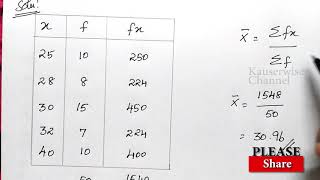
In case of discrete series, frequency against each observation is multiplied by the value of the observation. The values, so obtained, are summed up and divided by the total number of frequencies. Symbolically, X = ΣfX / Σf, where ΣfX = sum of the product of variables and frequencies.
Detailed Explanation
In a discrete series, we take each unique observation and determine how many times it appears (its frequency). We then calculate the total contribution of each observation to the dataset by multiplying the observation value by its frequency. After summing these products and dividing by the total frequency, we get the arithmetic mean. This allows us to effectively summarize data that's presented in groups rather than as individual data points.
Examples & Analogies
Consider a bakery that tracks how many loaves of bread they sell in quantities: 25 loaves at $2, 50 loaves at $3, and 15 loaves at $4. Rather than averaging the sales prices directly, the bakery multiplies each price by the number of loaves sold to find the total sales value, making it easier to calculate the average price per loaf sold.
Step Deviation Method in Grouped Data
Chapter 3 of 4
🔒 Unlock Audio Chapter
Sign up and enroll to access the full audio experience
Chapter Content
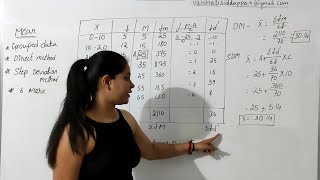
In this case, the deviations are divided by the common factor ‘c’ which simplifies the calculation. The formula for arithmetic mean using step deviation method is given as, X = A + (Σfd' / Σf) * c, where d' = (X – A) / c.
Detailed Explanation
The step deviation method is useful when handling large numbers or complex data sets. It involves selecting an 'assumed mean' (A), calculating deviations (d) of the actual data from this assumed mean, and rescaling these deviations using a common factor (c). This simplifies calculations, allowing for easier computation of the arithmetic mean by adjusting the sums through the factor c for clarity.
Examples & Analogies
Imagine a gardener measuring the height of different plants where heights vary widely from 1 cm to over 200 cm. Using the step deviation method, instead of calculating directly with these heights, the gardener could assume a mid-range height as a base and adjust all other heights relative to this base. This will allow him to compute the average height more straightforwardly.
Continuous Series and Calculating Arithmetic Mean
Chapter 4 of 4
🔒 Unlock Audio Chapter
Sign up and enroll to access the full audio experience
Chapter Content
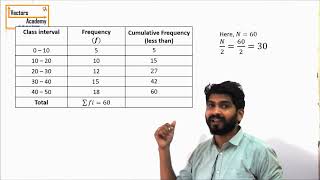
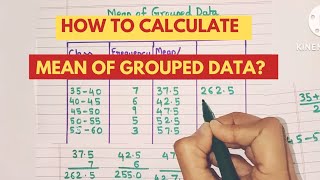
In case of continuous series, the process of calculating arithmetic mean is the same as that of a discrete series. The only difference is that the mid-points of various class intervals are taken.
Detailed Explanation
When dealing with continuous data, where data is grouped into intervals, the arithmetic mean calculation takes the mid-point of each interval as representative of that interval. We then multiply the mid-point by the frequency of the data within that interval and sum these products. Similar to discrete data, we divide the total by the sum of frequencies to find the mean.
Examples & Analogies
Consider a store that tracks daily sales in ranges: $0-$50, $51-$100, etc. Instead of knowing exact sales amounts, the manager uses the mid-point of these ranges to represent sales figures to calculate the average sales. For instance, for $0-$50, the mid-point is $25, which he uses to estimate overall performance.
Key Concepts
-
Arithmetic Mean: A calculation that provides the average of data points.
-
Grouped Data: Data that is organized into frequency groups.
-
Direct Method: A method for calculating mean using available data directly.
-
Assumed Mean: An arbitrary value assumed to ease calculations in large data sets.
Examples & Applications
Example of calculating the arithmetic mean for a set of student test scores.
Illustration of assumed mean method with economic data regarding community income.
Memory Aids
Interactive tools to help you remember key concepts
Rhymes
To find the mean, add and divide, the average number is your guide.
Stories
Once, a town gathered data on how many cakes were sold in each week. They grouped the data and found their average to better plan for the next week’s market.
Memory Tools
A.M.S - 'Add, Mean, Simplify' to remember how to work with Arithmetic Mean.
Acronyms
M.A.C - 'Mean as Central' helps recall that the mean serves as a central measure of data.
Flash Cards
Glossary
- Arithmetic Mean
A measure of central tendency calculated as the sum of all values divided by the number of observations.
- Grouped Data
Data that has been organized into groups or categories, often represented in frequency tables.
- Midpoint
The value located at the center of a class interval, used in calculations for grouped data.
- Assumed Mean
An arbitrary chosen mean value used in the Assumed Mean Method to simplify calculations.
- Direct Method
A systematic approach to calculate the arithmetic mean by directly using observations and their frequencies.
Reference links
Supplementary resources to enhance your learning experience.