
How Arithmetic Mean is Calculated
Enroll to start learning
You’ve not yet enrolled in this course. Please enroll for free to listen to audio lessons, classroom podcasts and take practice test.
Interactive Audio Lesson
Listen to a student-teacher conversation explaining the topic in a relatable way.
Introduction to Arithmetic Mean
🔒 Unlock Audio Lesson
Sign up and enroll to listen to this audio lesson

Today, we're going to explore the arithmetic mean. It's often what people think of when they hear the word 'average.' Does anyone know how to calculate it?

I think you add up all the numbers and then divide by how many numbers there are.
That's exactly right! To remember this, you might think of it as 'Sum then Count.' Now, can anyone tell me why the arithmetic mean is important?

Because it helps summarize data into one number?
Precisely! It helps us understand a dataset better. Let’s move on to the different methods of calculating it.
Direct Method of Calculation
🔒 Unlock Audio Lesson
Sign up and enroll to listen to this audio lesson

For our next topic, we will discuss the direct method. Let’s calculate the mean of these marks: 40, 50, 55, 78, 58.

Okay, so we add them: 40 + 50 + 55 + 78 + 58 equals 281.
Great! Now how many scores do we have?

Five scores!
Correct! Now divide 281 by 5. What do you get?
56.2!
Excellent! That's the mean. Remember, 'Sum and Count' helps you recall how to find it.
Assumed Mean Method
🔒 Unlock Audio Lesson
Sign up and enroll to listen to this audio lesson
Let’s delve into the assumed mean method, especially when we have large numbers. Has anyone heard of this method before?
Isn't that where you pick a number and work around it?
Exactly! You assume a mean, say A, and calculate deviations from this assumed value. Can anyone explain what a deviation is?
It’s the difference between each value and the assumed mean?
Right! For example, if we assume the mean to be 850 and calculate deviations, let’s find the actual mean. We'd sum those deviations, divide by the count, and add back to the assumed mean. That's a great method for large datasets!
Application in Grouped Data
🔒 Unlock Audio Lesson
Sign up and enroll to listen to this audio lesson
Now, let’s apply this to grouped data. Who can theorize how we might adjust our calculation?
We might need to multiply the frequencies by the mid-values?
Exactly! That's how we find the sum for each class. Then, we divide by the total frequencies. Remember, in grouped data, accuracy in counts is key!
So the arithmetic mean gives us insight into the whole distribution?
Absolutely! It represents the data set beautifully.
Introduction & Overview
Read summaries of the section's main ideas at different levels of detail.
Quick Overview
Standard
The arithmetic mean is a fundamental measure of central tendency, calculated as the sum of values divided by the total number of observations. It can be computed using direct and assumed mean methods, and is crucial for summarizing data sets effectively.
Detailed
Detailed Summary
The arithmetic mean, commonly referred to as the average, is a central statistical measure that summarizes a data set by calculating a single representative value. It is defined as the sum of all observations divided by the number of observations. This section introduces two primary methods for calculating the arithmetic mean: the direct method and the assumed mean method, useful when handling large data sets with large numerical values.
Key Concepts in Calculation:
- Direct Method: Simply sum all observations and divide by their count. For example, for a set of marks: 40, 50, 55, 78, 58, the arithmetic mean is calculated as follows:
Mean = (40 + 50 + 55 + 78 + 58) / 5 = 56.2
- Assumed Mean Method: This method is advantageous when dealing with large observations. Here, you assume a mean, find deviations from this assumed mean, and calculate the actual mean using these deviations.
To illustrate, suppose we assume the mean to be A and calculate deviations d = X - A. Summing the deviations and adjusting with A allows us to estimate the actual arithmetic mean more efficiently.
The section also touches on the calculation for grouped data where the arithmetic mean can be derived from frequency distributions, using modular approaches to yield accurate insights from larger datasets. The arithmetic mean is a useful tool in various domains, helping to draw effective conclusions and summarize data succinctly.
Youtube Videos


Audio Book
Dive deep into the subject with an immersive audiobook experience.
Overview of Arithmetic Mean
Chapter 1 of 7
🔒 Unlock Audio Chapter
Sign up and enroll to access the full audio experience
Chapter Content
The average mark of students in the economics test is 56.2.
Detailed Explanation
The arithmetic mean is a statistical measure that represents the central point of a data set. In this example, it indicates that the average score of students in the economics test is 56.2, showing how well the students performed on average.
Examples & Analogies
Imagine a basketball team where each player scores different points in a game. The arithmetic mean would give the overall average score per player, helping coaches understand team performance as a whole.
Categories of Calculating Arithmetic Mean
Chapter 2 of 7
🔒 Unlock Audio Chapter
Sign up and enroll to access the full audio experience
Chapter Content
The calculation of the arithmetic mean can be studied under two broad categories: 1. Arithmetic Mean for Ungrouped Data. 2. Arithmetic Mean for Grouped Data.
Detailed Explanation
Arithmetic mean can be calculated for two main types of data: ungrouped data, which consists of individual observations, and grouped data, where observations are organized into groups or classes. Understanding the difference helps in choosing the correct method for calculation based on the data type.
Examples & Analogies
Think of ungrouped data as individual test scores from students, while grouped data could be class averages calculated from groups of students. Each approach offers a different way to summarize performance.
Direct Method for Ungrouped Data
Chapter 3 of 7
🔒 Unlock Audio Chapter
Sign up and enroll to access the full audio experience
Chapter Content
Arithmetic mean by direct method is the sum of all observations in a series divided by the total number of observations.
Detailed Explanation
To calculate the arithmetic mean using the direct method, you add up all the individual values (observations) and then divide that sum by the total number of observations. It's a straightforward approach when handling a small set of data.
Examples & Analogies
If five friends scored 40, 50, 55, 78, and 58 in an exam, you would first add these scores (40 + 50 + 55 + 78 + 58 = 281) and then divide by the number of friends (5), resulting in an average score of 56.2.
Assumed Mean Method
Chapter 4 of 7
🔒 Unlock Audio Chapter
Sign up and enroll to access the full audio experience
Chapter Content
In order to save time in calculating mean from a data set containing a large number of observations as well as large numerical figures, you can use assumed mean method.
Detailed Explanation
The assumed mean method simplifies the calculation process, especially when dealing with large data sets. You begin by assuming a mean value based on previous experience or logic, then calculate deviations from this assumed mean, and finally estimate the actual mean using these deviations and the total number of observations.
Examples & Analogies
Imagine you are estimating the average cost of groceries in a large store. Instead of calculating every single price, you might assume an average price of Rs 100 based on your past shopping. You then adjust your calculations based on actual prices to arrive closer to the true average.
Step Deviation Method
Chapter 5 of 7
🔒 Unlock Audio Chapter
Sign up and enroll to access the full audio experience
Chapter Content
The calculations can be further simplified by dividing all the deviations taken from assumed mean by the common factor ‘c’.
Detailed Explanation
The step deviation method reduces the complexity of calculations further by most significantly reducing the size of numerical figures through a common factor. This method is particularly useful when individual deviations yield very large or confusing numbers.
Examples & Analogies
Think of counting large amounts of money. Instead of counting every single coin, you could classify them into groups (like Rs 10, Rs 20, etc.) which simplifies the overall calculation of your total money.
Grouped Data Calculation
Chapter 6 of 7
🔒 Unlock Audio Chapter
Sign up and enroll to access the full audio experience
Chapter Content
In case of discrete series, calculations can be simplified by using assumed mean method, as described earlier, with a simple modification.
Detailed Explanation
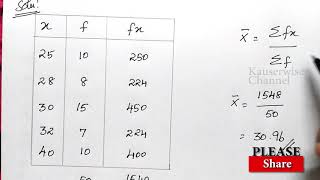
When dealing with grouped data, the arithmetic mean can be calculated efficiently by multiplying each observation by its frequency, summing these products, and then dividing by the total frequency. This method streamlines calculations that would otherwise be cumbersome if done on individual data points.
Examples & Analogies
Imagine a teacher wants to find out the average score of test results from different classes. Instead of adding each individual score, the teacher can simply multiply the average score of each class by the number of students in that class to get the total score quickly.
Continuous Series Calculation
Chapter 7 of 7
🔒 Unlock Audio Chapter
Sign up and enroll to access the full audio experience
Chapter Content
In case of continuous series, the process of calculating arithmetic mean is the same as that of a discrete series.
Detailed Explanation
For continuous data, the calculation of the mean involves defining ranges (or intervals) and calculating midpoints for these intervals. The overall average is then determined from these values and their respective frequencies, similar to how it's done for discrete series but utilizing the midpoints for accuracy.
Examples & Analogies
When you calculate average heights of people categorized into height ranges (like 5'0" to 5'5"), you find the midpoint for each range and apply that in your calculations, just as you would find the average for specific scores.
Key Concepts
-
Direct Method: Calculating the mean directly using the sum and count.
-
Assumed Mean: Using an estimated mean to simplify calculations, especially for larger data sets.
-
Grouped Data: Calculating the mean using class frequencies.
Examples & Applications
Example 1: To find the average of student marks: 40, 50, 55, 78, 58. The steps are: sum these values and divide by 5, resulting in a mean of 56.2.
Example 2: Using the assumed mean method, if you have a range of incomes, assume an average like 1000, find deviations, and adjust accordingly to get the real mean.
Memory Aids
Interactive tools to help you remember key concepts
Rhymes
To find the mean, don't just scream, add and count, it's a dream!
Stories
In a small village, a farmer wanted to know his average crop yield. He gathered all his harvest results, added them up, and divided by his total harvest days to find a number that represented his effort.
Memory Tools
S and C: Sum and Count to find Mean!
Acronyms
SAM
Sum And Mean.
Flash Cards
Glossary
- Arithmetic Mean
The sum of a set of values divided by the number of values, commonly known as the average.
- Deviation
The difference between an individual observation and a reference value (like the assumed mean).
- Assumed Mean Method
A method of calculating the arithmetic mean by first assuming a mean value and computing deviations from it.
- Grouped Data
Data that is organized into groups or classes, commonly used for larger datasets.
Reference links
Supplementary resources to enhance your learning experience.