
Direct Method - 5.2.1.2.2.1
Enroll to start learning
You’ve not yet enrolled in this course. Please enroll for free to listen to audio lessons, classroom podcasts and take practice test.
Interactive Audio Lesson
Listen to a student-teacher conversation explaining the topic in a relatable way.
Understanding Class Intervals
🔒 Unlock Audio Lesson
Sign up and enroll to listen to this audio lesson

Today, we're diving into class intervals! Does anyone know what a class interval is?

Isn't it the range of values that we group the data into?
Exactly! Class intervals help us organize scores into manageable ranges. For instance, in our example, we grouped marks from 0 to 10, 10 to 20, and so on. This simplifies analysis.

So, why do we use mid values within these intervals?
Great question! The mid value represents a central point of the class. By using mid values, we can calculate totals more easily. Remember, mid value can be calculated as (lower limit + upper limit) / 2.

What do we do after calculating mid values?
Next, we multiply each mid value by its corresponding frequency. This helps us calculate the sum needed for our average marks. Let's summarize: Class intervals help organize data; mid values are central points; and we multiply to find totals!
Calculating the Average Marks
🔒 Unlock Audio Lesson
Sign up and enroll to listen to this audio lesson

Now, let's use the mid values and frequencies to find the average marks. Who remembers the formula?

Isn't it X = Σfm / f?
Correct! So, first we need the sum of fm. Who can calculate Σfm from our example?
I see that the sum is 2110.
Well done! Now, what is our total frequency f?
It’s 70, right?
Yes, precisely! Now plug these into the formula. What do we get for X?
It’s approximately 30.14 marks!
Excellent! So, to summarize: we calculated the average by finding Σfm, finding f, and applying X = Σfm / f. This is how the Direct Method works!
Interpreting Results
🔒 Unlock Audio Lesson
Sign up and enroll to listen to this audio lesson
Now that we have our average, what does an average of 30.14 marks signify?
It indicates the typical score among students in this class!
Exactly! Average marks allow us to understand the overall performance. But can it tell us everything about the data set?
No, averages can sometimes be misleading if outliers exist!
Correct! Averages summarize data but don’t show its spread. That’s why we might also look at median or mode for a better understanding. To recap: average marks give insight but must be interpreted carefully!
Introduction & Overview
Read summaries of the section's main ideas at different levels of detail.
Quick Overview
Standard
This section explains the Direct Method for computing average marks from a frequency distribution table. It involves identifying mid values for class intervals and applying the direct method formula to derive the average marks.
Detailed
Detailed Summary of the Direct Method
The Direct Method is a statistical technique used to compute the average marks from a frequency distribution of scores. This method is particularly effective when working with grouped data. In this section, we consider a range of marks and the number of students obtaining those marks, presented in a frequency distribution table. The key steps of the Direct Method include:
- Extract Mid Values (m): Compute the mid values for each class interval, which are defined as the average of the lower and upper limits of the classes.
- Frequency (f): Determine the number of students (frequency) associated with each class interval.
- Calculate fm and fd': Calculate the product of the mid value and frequency for each interval, denoted as fm. Additionally, calculate the deviation of mid values from the mean and multiply by the frequency to obtain fd'.
- Apply the Direct Method Formula: Finally, compute the average score using the formula
$$ X = \frac{\Sigma fm}{f} $$ where \( \Sigma fm \) is the sum of fm, and f is the total frequency.
In the provided example, the procedure results in an average score of 30.14 marks, illustrating how the Direct Method effectively summarizes data from frequency distributions.
Youtube Videos


Audio Book
Dive deep into the subject with an immersive audiobook experience.
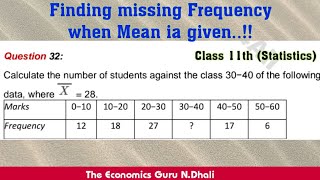
Marks Distribution Table
Chapter 1 of 3
🔒 Unlock Audio Chapter
Sign up and enroll to access the full audio experience
Chapter Content
Marks
0–10 10–20 20–30 30–40 40–50
50–60 60–70
No. of Students
5 12 15 25 8
3 2
TABLE 5.3
Detailed Explanation
This chunk presents a table displaying the distribution of marks among students across different ranges. The range of marks is divided into intervals like 0-10, 10-20, and so on, with the corresponding number of students who scored within those intervals. For example, 5 students scored between 0-10 marks, and 12 students scored between 10-20 marks, etc. This data helps in understanding how students' performance is spread out across different scoring brackets.
Examples & Analogies
Imagine a teacher wants to know how well her students did in a recent exam. She organizes the scores into ranges, like scores between 0 and 10, and counts how many students fit into each category. This way, she can quickly grasp the overall performance of the class.
Computation of Average Marks
Chapter 2 of 3
🔒 Unlock Audio Chapter
Sign up and enroll to access the full audio experience
Chapter Content
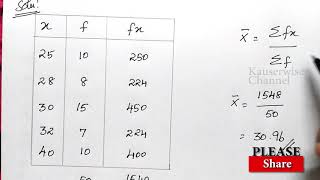
Computation of Average Marks for Exclusive Class Interval by Direct Method
Mark No. of Mid fm d'=(m-35) fd'
(x) students value (2)×(3) 10
(f) (m)
(1) (2) (3) (4) (5) (6)
0–10 5 5 25 –3 –15
10–20 12 15 180 –2 –24
20–30 15 25 375 –1 –15
30–40 25 35 875 0 0
40–50 8 45 360 1 8
50–60 3 55 165 2 6
60–70 2 65 130 3 6
70 2110 –34
Detailed Explanation
In this chunk, the calculation of average marks using the Direct Method is shown. Each class interval has corresponding data, including mid values (m), number of students (f), the product of these two (fm), and deviations from a mean value (d'). The table summarizes the calculations, leading to a subtotal of 2110 for fm. The average (X) is then derived from the total of fm divided by the total number of students (f), resulting in an average of approximately 30.14 marks.
Examples & Analogies
Consider you're trying to find out the average score of a group of friends who just played a video game. You jot down how many points each friend scored in specific ranges, like '0-10 points', '11-20 points', etc. Then, you calculate their total scores by multiplying the number of friends within each range by the average score of that range, just like taking several small groups and calculating their contributions to a final average score.
Steps to Calculate Average Marks
Chapter 3 of 3
🔒 Unlock Audio Chapter
Sign up and enroll to access the full audio experience
Chapter Content
Steps:
1. Obtain mid values for each class denoted by m.
2. Obtain Σ fm and apply the direct method formula:
X = fm
f
=
2110
70
=
30.14 marks
Detailed Explanation
This final chunk details the steps to compute the average marks using the Direct Method. First, you calculate the mid values (m) for each mark range, which represents the average mark for that interval. Next, sum up the products of the number of students and their mid values (Σ fm). Finally, divide this total by the total number of students (f) to arrive at the average marks. In this case, dividing 2110 by 70 gives an average of around 30.14 marks.
Examples & Analogies
Think of it as an average height calculation at a school. You measure a group of kids and group their heights into ranges, find the midpoint of each range to represent typical heights, and then calculate an overall average height by combining all the groups together. Just as with marks, the process involves taking midpoints and dividing by total number of students to find the average.
Key Concepts
-
Class Interval: A range of values grouped to simplify data analysis.
-
Mid Value: A central point of the class interval for calculations.
-
Frequency: The count of data points within each class interval.
-
Average Marks: The computed mean value of the scores.
-
Direct Method: A systematic approach to find averages from grouped data.
Examples & Applications
In a class of students, marks are distributed in intervals such as 0-10, 10-20. Analyzing these intervals helps find trends in student performance.
Given a frequency table, calculating the average provides insights into overall class performance and highlights potential educational gaps.
Memory Aids
Interactive tools to help you remember key concepts
Rhymes
To find the average, don't delay, mid values lead the way!
Stories
Imagine a teacher organizing students by scores. Each group leads to the grand average, helping understand performance!
Memory Tools
MFF: Mid, Frequency, Formula! Remember these steps for the Direct Method.
Acronyms
CAB
Class
Average
Breakdown. A reminder of what we calculated and why!
Flash Cards
Glossary
- Class Interval
A range of values grouped together to organize data effectively.
- Mid Value
The central point of a class interval, calculated by averaging the lower and upper class limits.
- Frequency (f)
The number of occurrences of scores within a given class interval.
- Average Marks (X)
The arithmetic mean obtained from a set of values, calculated as the sum of values divided by their count.
- Direct Method
A statistical method to compute averages from grouped data using frequency distributions.
Reference links
Supplementary resources to enhance your learning experience.