
CONCLUSION
Enroll to start learning
You’ve not yet enrolled in this course. Please enroll for free to listen to audio lessons, classroom podcasts and take practice test.
Interactive Audio Lesson
Listen to a student-teacher conversation explaining the topic in a relatable way.
Importance of Measures of Central Tendency
🔒 Unlock Audio Lesson
Sign up and enroll to listen to this audio lesson

Today, we're going to discuss the importance of measures of central tendency. Can anyone tell me what these measures are?

I think they are the mean, median, and mode.
Correct! These measures help us summarize data with a single number. Why do we need to summarize data?

To make it easier to understand?
Exactly! It's about grasping the bigger picture quickly. Remember the acronym 'M&M & A'? It stands for Mean, Median, and Mode, which are 'Averages' vital for analysis. Any questions about why we use them?
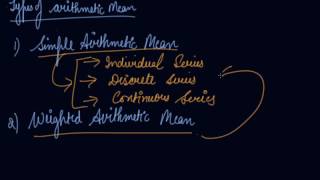
Arithmetic Mean
🔒 Unlock Audio Lesson
Sign up and enroll to listen to this audio lesson

Now let's focus on the arithmetic mean. Why do you think it's the most commonly used measure?

Because it uses all the data points?
Right! However, it can be skewed by outliers. Let's recall the formula: the sum of all values divided by the number of values. Can anyone give me an example where the mean might mislead us?

If one person's salary in a group is way higher than the others, right?
Exactly! Such values can distort the mean. Let's remember this—'Outliers can pout!'—a mnemonic for keeping in mind that outliers affect the mean.
Median vs. Mode
🔒 Unlock Audio Lesson
Sign up and enroll to listen to this audio lesson
Next, let's compare the median and mode. When do you think we should use the median instead of the mean?
When data is skewed?
Correct! The median provides a better central value in such cases. What's the mode's main function?
To find the most common value?
Exactly! Remember the phrase 'What’s most frequent is significant'? This highlights the mode's strength in categorical data. Can someone think of a scenario where mode would be important?
Fashion industry trends, maybe?
Great example! Trends rely heavily on the mode to identify preferred items. Let's summarize: 'Median is resilient; Mode is popular!'
Conclusion Highlights
🔒 Unlock Audio Lesson
Sign up and enroll to listen to this audio lesson
As we conclude, can anyone summarize why understanding these averages is important?
To analyze data effectively and choose the right measure for each situation?
Exactly! Choosing the right measure can enrich our understanding. Remember—'Know your average!' This will guide you in analysis. Any last questions?
Introduction & Overview
Read summaries of the section's main ideas at different levels of detail.
Quick Overview
Standard
The conclusion highlights the importance of measures of central tendency, including the arithmetic mean, median, and mode, emphasizing their applicability in summarizing and interpreting data effectively while addressing the nuances of their use.
Detailed
Conclusion
Measures of central tendency provide a concise numerical value that summarizes a dataset, thereby representing its overall characteristics. The three primary types of averages discussed include the arithmetic mean, median, and mode. Each measure plays a critical role depending on the nature of the data and its distribution. The arithmetic mean is widely used due to its simplicity and comprehensive nature, although it can be skewed by extreme values. The median offers a more robust central value when distributions are uneven, reflecting a true center without the influence of outliers. Finally, the mode is ideal for categorical data, pinpointing the most frequently occurring item in a dataset. Understanding the context and selection of these averages is crucial for effective data analysis.
Youtube Videos

Key Concepts
-
Mean: The average of a set of numbers derived from the total sum divided by how many numbers there are.
-
Median: A middle value separating the higher half from the lower half in a dataset.
-
Mode: The highest frequency value in a dataset that may show trends.
Examples & Applications
If you have numbers 1, 2, 2, 3, 4, the mean is (1+2+2+3+4)/5 = 2.4, the median is 2, and the mode is 2.
In a test where students scored: 30, 40, 50, 50, 60, 70, the mean score is 50, median is 50, and mode is 50.
Memory Aids
Interactive tools to help you remember key concepts
Rhymes
In a set of numbers, large and small, the mean finds the average of them all.
Stories
Imagine a bakery where the basket has a different number of pastries. The mode is the flavor that everyone loves most, while the median is the perfect slice in the middle of the tray!
Memory Tools
Remember AMM for Average, Median, and Mode!
Acronyms
M&M & A = Mean, Median, and Mode – three keys to understanding data’s way!
Flash Cards
Glossary
- Arithmetic Mean
The average calculated by summing all observations and dividing by the number of observations.
- Median
The middle value that separates the higher half from the lower half of the data set.
- Mode
The value that appears most frequently in a data set.
- Central Tendency
Statistical measures that describe the center of a data set.
- Outlier
An observation that lies an abnormal distance from other values in a dataset.
Reference links
Supplementary resources to enhance your learning experience.