
Step Deviation Method - 5.2.1.2.1.3
Enroll to start learning
You’ve not yet enrolled in this course. Please enroll for free to listen to audio lessons, classroom podcasts and take practice test.
Interactive Audio Lesson
Listen to a student-teacher conversation explaining the topic in a relatable way.
Introduction to STEP Deviation Method
🔒 Unlock Audio Lesson
Sign up and enroll to listen to this audio lesson

Today, we are going to explore the STEP Deviation Method. Can anyone tell me why we might want to simplify our calculations when working with data?

So we don’t get overwhelmed with large numbers?
Exactly! Large numbers can complicate our work. In this method, we introduce a common factor ‘c’ to simplify our computations. Can anyone guess what we might do with our deviations?

Maybe divide them by that number we mentioned?
Right on! By estimating the adjusted deviation as `d' = d/c`, we make it easier to handle. Remember this: Simplification helps us avoid errors in calculations.
Calculating the Mean with STEP Deviation Method
🔒 Unlock Audio Lesson
Sign up and enroll to listen to this audio lesson

Now let's apply what we learned. The formula for our arithmetic mean is `X̄ = A + (fd' * Σ Σ)`. Who can remind us what each term stands for?

X̄ is the mean, A is the assumed mean, and fd' is our adjusted sum of deviations.
Perfect! And when we apply this to our dataset, it allows us to find insights quickly. Can anyone suggest a scenario where this might be useful?

In agriculture, to find average plot sizes might help determine resource allocation.
Exactly! Excellent point. This method plays a crucial role in such analyses.
Example Calculation
🔒 Unlock Audio Lesson
Sign up and enroll to listen to this audio lesson
Let’s work through an example together. We need to find the mean plot size from example 3. What do we start with?
We should first gather the necessary data!
Correct! We will collect our deviations and then divide them by our common factor ‘c’. What’s next after that?
We can calculate fd’ next!
Exactly! The calculations lead us to `Σ fd'`, which we'll incorporate into our arithmetic mean formula. This systematic approach ensures accuracy!
Introduction & Overview
Read summaries of the section's main ideas at different levels of detail.
Quick Overview
Standard
In the STEP Deviation Method, deviations are divided by a common factor, making calculations easier. The arithmetic mean is calculated using subtracted values adjusted by this factor, which streamlines results and enhances accuracy. This technique is particularly useful for analyzing large datasets.
Detailed
STEP Deviation Method
The STEP Deviation Method is a technique used in statistics to simplify the calculation of the arithmetic mean when presented with a dataset containing large numerical values. By dividing the deviations from the mean by a common factor denoted as ‘c’, the computations are made more manageable. The key steps involve estimating the adjusted deviation (d') using the formula d' = d/c, thereby reducing the size of numerical figures. This method helps to systematically compute fd' and the summation of Σ fd'. Ultimately, the arithmetic mean can be derived from the formula:
X̄ = A + (fd' * Σ Σ), where X̄ is the mean, A is the assumed mean, fd' represents the modified sum of deviations, and ΣΣ is the total frequency. The method's practicality is illustrated by an application to find the mean plot size in specific examples, providing vital insights into census data handling.
Youtube Videos


Audio Book
Dive deep into the subject with an immersive audiobook experience.
Understanding Deviations with Common Factor
Chapter 1 of 5
🔒 Unlock Audio Chapter
Sign up and enroll to access the full audio experience
Chapter Content
In this case, the deviations are divided by the common factor ‘c’ which simplifies the calculation.
Detailed Explanation
In the STEP Deviation Method, we first identify deviations from a central value (mean, in a sense). Instead of working with these deviations directly, we divide them by a common factor, referred to as 'c'. This operation makes our calculations simpler and more manageable, particularly when working with larger datasets or values.
Examples & Analogies
Imagine you have a group of friends all measuring their heights with a tape measure, but every time they measure, they use a different unit—like inches or centimeters. To simplify comparing these heights, you'd convert them to a common unit. Similarly, dividing by 'c' helps us work in a common framework, making it easier to understand and calculate.
Estimating Deviations and Calculating d'
Chapter 2 of 5
🔒 Unlock Audio Chapter
Sign up and enroll to access the full audio experience
Chapter Content
Here we estimate d' = (d/c), in order to reduce the size of numerical figures for easier calculation.
Detailed Explanation
After dividing the deviations by the common factor 'c', we denote this adjusted deviation as d'. This transformation allows us to reduce the numerical values we are working with, which minimizes computational complexity. It breaks down the calculations into simpler steps and helps prevent errors during the process.
Examples & Analogies
Think of d' like cutting a large recipe into smaller portions. For instance, if a recipe calls for 4 cups of flour but you only want to make a quarter of it, you divide everything by 4, making it easier to handle small amounts. Similarly, the STEP Deviation Method makes complex calculations simpler and more accurate by scaling down values.
Finding Summations of Deviations
Chapter 3 of 5
🔒 Unlock Audio Chapter
Sign up and enroll to access the full audio experience
Chapter Content
Then get fd' and Σ fd'.
Detailed Explanation
In this step, we calculate two important values: fd' (the product of the frequency and the adjusted deviations) and Σ fd' (the sum of these products). These calculations are crucial because they summarize the overall effect of the deviations across the entire dataset, providing a clear view of the distribution.
Examples & Analogies
Imagine you're at a carnival collecting tickets for different rides based on how many friends you brought. If each friend represents a frequency and the number of tickets is like your deviations, multiplying these (fd') tells you how many total tickets each group of friends has collected. Summing these up (Σ fd') gives you the total tickets for the entire carnival—a clear picture of participation.
Arithmetic Mean Formula Using STEP Deviation Method
Chapter 4 of 5
🔒 Unlock Audio Chapter
Sign up and enroll to access the full audio experience
Chapter Content
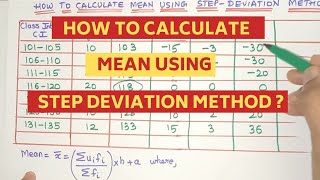
The formula for arithmetic mean using step deviation method is given as, X̄ = A + (fd'/Σf) × c.
Detailed Explanation
Finally, the arithmetic mean using the STEP Deviation Method is calculated using the given formula. Here, 'A' is the assumed mean, fd' is the summation of the products we calculated earlier, Σf represents the total frequency, and 'c' is the common factor. This formula allows us to effectively find the mean in a simplified manner by integrating the previously calculated values.
Examples & Analogies
Think of this formula as a recipe for making your favorite dish. The 'A' is your base ingredient (assumed mean), the fd' adds the special spices (the effects of deviations), and doubling or halving the recipe by 'c' helps adjust your final dish size (mean). By putting all these together correctly, you get a delicious final product—the arithmetic mean!
Activity Implementation
Chapter 5 of 5
🔒 Unlock Audio Chapter
Sign up and enroll to access the full audio experience
Chapter Content
• Find the mean plot size for the data given in example 3, by using step deviation and assumed mean methods.
Detailed Explanation
This activity invites you to apply the concepts learned by calculating the mean plot size using the STEP Deviation Method as well as the assumed mean method. By engaging in this practical exercise, you can reinforce your understanding and gain hands-on experience in employing the step deviation approach.
Examples & Analogies
Think of this activity like a fitness tracker where you’re measuring the average distance you run each week through different methods. By applying both the step deviation and assumed mean methods, you're not only checking your distance but also learning how to adapt and analyze your data better, ensuring you're making the right progress.
Key Concepts
-
STEP Deviation Method: A technique used to simplify calculations by adjusting deviations with a common factor.
-
Common Factor (c): Reduces numbers to make arithmetic operations simpler.
-
Arithmetic Mean: The average value calculated by adding a set of numbers and dividing by the total count.
-
Adjusted Deviations (d'): A simplified form of deviations calculated to ease computations.
Examples & Applications
Example of calculating adjusted deviations for a dataset using c = 10.
Finding the mean plot size in a case study illustrating the application of the STEP Deviation Method.
Memory Aids
Interactive tools to help you remember key concepts
Rhymes
In steps we take our c, deviations small you'll see.
Stories
Imagine a gardener who wants to know the average height of his plants. By measuring each one, he finds the numbers are huge! He decides to simplify by dividing by 10, making it easy to find the average size and help his garden grow!
Memory Tools
Remember 'ADAM' for the STEP Deviation Method: Adjust, Divide, Adjusted Mean.
Acronyms
C.A.S.E - Common factor Adjusts Simplified Ease!
Flash Cards
Glossary
- Deviation
The difference between a data point and the mean, indicating how far it is from the average.
- Common Factor (c)
A number used to simplify calculations in the STEP Deviation Method.
- Arithmetic Mean
A statistical measure commonly referred to as the average, calculated by summing all values and dividing by their count.
- fd'
Represents the modified sum of deviations, calculated after applying the common factor.
- Assumed Mean (A)
The mean value chosen beforehand around which deviations are computed.
Reference links
Supplementary resources to enhance your learning experience.