
Step Deviation Method - 5.2.1.1.3
Enroll to start learning
You’ve not yet enrolled in this course. Please enroll for free to listen to audio lessons, classroom podcasts and take practice test.
Interactive Audio Lesson
Listen to a student-teacher conversation explaining the topic in a relatable way.
Introduction to Step Deviation Method
🔒 Unlock Audio Lesson
Sign up and enroll to listen to this audio lesson

Today, we're exploring the Step Deviation Method. Can anyone tell me why we might need this method?

Maybe to make calculations easier?
Exactly! We use this method especially when our data includes large figures. Let's start by defining what an 'assumed mean' is. Can anyone suggest what a good mean would be?

I think it should be a number that's in the middle of the data!
Correct! Choosing a number that is central helps to minimize large deviations. Let's remember this with the acronym AM for 'Assumed Mean.'

Does the assumed mean have to be one of the actual data points?
Great question! It doesn't have to be. The goal is to make calculations manageable. Now, let's talk about how to calculate deviations.

Is that when we find the difference between each value and the assumed mean?
Exactly, Student_4! Remember, we can use the formula: d = X - A. Now, let's summarize today's lesson: the Step Deviation Method helps us simplify calculations by using an assumed mean.
Scaling Deviations
🔒 Unlock Audio Lesson
Sign up and enroll to listen to this audio lesson

Now that we've discussed deviations, let's explore how we can scale these using a common factor. Who can remind me what we mean by scaling?
It’s about dividing the deviations by a common factor, right?
Precisely! This will help us avoid dealing with large numbers. For example, if our common factor was 10, then what would d' be if d = 500?
It would be 50!
Correct! Remember this method with the phrase 'Scale to Simplify.' Finally, let's look at our formula where we include the sum of these scaled deviations. Can anyone tell me what next?
Do we add it to the assumed mean?
Yes! The formula is X = A + Σd' * c/N. Let’s summarize, scaling deviations makes them easier to work with, leading us to our final mean.
Applications of the Step Deviation Method
🔒 Unlock Audio Lesson
Sign up and enroll to listen to this audio lesson
Let's discuss how the Step Deviation Method could help in real-life situations. Can anyone think of scenarios where we might use it?
Maybe in economics when calculating averages from a large dataset?
Absolutely! Any field that requires handling large, varied numbers. For instance, calculating average monthly income across several households. We don’t want to deal with huge sums. What's our assistance here?
We can just use an assumed mean to simplify it!
Yes! This shows how flexible and useful the method can be beyond just math. Let’s wrap up: the Step Deviation Method is useful for simplifying complex calculations in real-world applications.
Introduction & Overview
Read summaries of the section's main ideas at different levels of detail.
Quick Overview
Standard
This section focuses on the Step Deviation Method, highlighting how it simplifies the calculation of the Arithmetic Mean through the use of an assumed mean and a common divisor to reduce large numerical figures, making statistical analysis more manageable.
Detailed
Detailed Summary
The Step Deviation Method is an approach used to calculate the Arithmetic Mean more efficiently, especially when handling large data sets or wide value ranges. By selecting an 'assumed mean' from the dataset, the deviations of actual data points from this mean are calculated and scaled by a common factor. This not only simplifies calculations by converting large deviations into manageable figures but also allows for easier summation of these scaled values.
Key Steps in the Step Deviation Method:
- Assumed Mean: Choose a centrally located value from your dataset as the assumed mean (denoted as A).
- Calculating Deviations: For each data point (X), calculate the deviation from the assumed mean (d = X - A).
- Scaling Deviations: Divide these deviations by a common factor (c) to simplify the calculations (d' = d/c).
- Final Formula: The final mean is calculated using the formula:
where Σd' is the sum of the scaled deviations, and N is the number of observations.
This method is particularly useful for large datasets where direct calculation would be cumbersome. With this organized approach, statisticians can focus on summarized statistical results without being bogged down by large numerical figures.
Youtube Videos


Audio Book
Dive deep into the subject with an immersive audiobook experience.
Introduction to Step Deviation Method
Chapter 1 of 4
🔒 Unlock Audio Chapter
Sign up and enroll to access the full audio experience
Chapter Content
The calculations can be further simplified by dividing all the deviations taken from assumed mean by the common factor ‘c’. The objective is to avoid large numerical figures, i.e., if d = X – A is very large, then find d'.
Detailed Explanation
The Step Deviation Method is an approach to simplify the calculation of the arithmetic mean, especially when dealing with large numbers or when the values of the data set are widely spread apart. Instead of using the actual observations directly, we first select an 'assumed mean' (A) near the central value. Then, we calculate the deviations from this assumed mean. To make calculations easier, we divide these deviations by a common factor (c), which helps in keeping the values smaller and neater.
Examples & Analogies
Imagine you're organizing a yearly charity drive and you have to calculate donations from various sources. Some sources give hundreds while others give thousands. If you simply add up all the donations, it may take time due to big numbers. Instead, you could take a common average amount and calculate how much each source deviated from that average. Then, by simplifying those deviations, the overall computation becomes easier.
Formula for Step Deviation Method
Chapter 2 of 4
🔒 Unlock Audio Chapter
Sign up and enroll to access the full audio experience
Chapter Content
The formula is given below:
X = A + (Σd') / N, where d' = (X – A) / c, c = common factor, N = number of observations, A = Assumed mean.
Detailed Explanation
In the Step Deviation Method, the mean is calculated using a formula that involves the assumed mean, the sum of the deviations divided by the common factor, and the total number of observations. Here, 'd'' represents the deviation of individual observations from the assumed mean, standardized by dividing by 'c', the common factor. By reorganizing the formula to solve for X (the mean), you streamline calculations, making it efficient to derive results, especially in cases with large datasets.
Examples & Analogies
Consider a gardener who is measuring the height of various plants in a garden. If the height of the plants varied from just a few centimeters to over a meter, he could take an average height that he expects (assumed mean) and see how much each plant deviates from that. By using the Step Deviation Method, he can calculate the average height of all plants with much easier numbers, making his task quicker.
Calculation Example using Step Deviation
Chapter 3 of 4
🔒 Unlock Audio Chapter
Sign up and enroll to access the full audio experience
Chapter Content
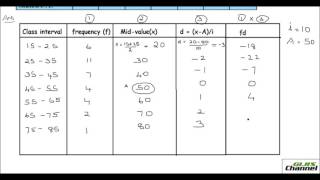
Example 2: The following data shows the weekly income of 10 families:
Family: A=850, B=700, C=100, D=750, E=5000, F=80, G=420, H=2500, I=400, J=360
Compute mean family income using step deviation method.
Detailed Explanation
To calculate the mean using the Step Deviation Method, you first note down the weekly incomes of the families. Then, you will select an assumed mean (let's say 850) and compute the deviations for each family’s income from this assumed mean. After that, divide these deviations by a common factor (c) to simplify them. Finally, substituting these simplified deviations into the formula, you'll derive the overall average income for the families in a more structured manner, easing the calculation process.
Examples & Analogies
Imagine a classroom of students reporting their weekly allowances. Some students get a tiny amount, while others have quite a bit more. Instead of working with very high or low numbers directly, if you have a class average in mind, you can adjust each student’s reported amount against this average. This makes it easier to find out how much the average student actually earns in terms of allowance, without getting caught up in the huge variations.
Conclusion of the Step Deviation Method
Chapter 4 of 4
🔒 Unlock Audio Chapter
Sign up and enroll to access the full audio experience
Chapter Content
This method helps reduce complexity in calculations involving large data sets, making it a preferred option in statistics.
Detailed Explanation
The Step Deviation Method ultimately serves to make statistical calculations involving large sets of data manageable. By reducing the numerical complexity through the use of assumed means and simplified deviations, this method stands as an efficient approach in both academic and real-world statistical analysis. It showcases the importance of choosing appropriate methods based on the nature of the data.
Examples & Analogies
Think of a chef calculating the ingredients needed for cooking for a large group. Instead of listing each individual ingredient amount and risk confusion, the chef uses standard measures (like cups or teaspoons) as their base quantities. The chef then adjusts each ingredient based on this standard measure for the expected number of guests. This makes the cooking process smoother and ensures that the final dish is well-prepared, just like the Step Deviation Method streamlines calculations.
Key Concepts
-
Assumed Mean: A central value used to calculate deviations in the step deviation method.
-
Deviation: The difference between the observed value and the assumed mean.
-
Scaling: The process of dividing deviations by a common factor to simplify calculations.
-
Final Mean Calculation: Formula used to calculate the final mean from scaled deviations.
Examples & Applications
For a dataset of family incomes: If the assumed mean is Rs 1500 and the incomes are Rs 1400, Rs 1600, Rs 1700, then the deviations are -100, +100, +200 respectively. After scaling, we calculate the final mean easily.
In agriculture, if the yields are vast, using an assumed mean can help simplify the calculations of overall productivity from various farms.
Memory Aids
Interactive tools to help you remember key concepts
Rhymes
Assume a mean, don’t get lost, scale it right and count the cost.
Stories
Imagine a farmer calculating his harvests. To understand his average yield, he picks a rough estimate and scales each yearly yield around it, making his calculations easier.
Memory Tools
AMDS – Assumed Mean, Deviation, Scaled Deviations.
Acronyms
USE – Utilize Step Deviation for Easier calculations.
Flash Cards
Glossary
- Assumed Mean
A value chosen from the data that is used to calculate deviations for simplifying mean calculations.
- Deviation
The difference between an individual data point and the assumed mean.
- Scaled Deviation
A deviation that has been divided by a common factor to simplify calculation.
- Arithmetic Mean
The average of a data set, calculated by summing all values and dividing by the number of observations.
Reference links
Supplementary resources to enhance your learning experience.