
TABULATION OF DATA AND PARTS OF A TABLE
Enroll to start learning
You’ve not yet enrolled in this course. Please enroll for free to listen to audio lessons, classroom podcasts and take practice test.
Interactive Audio Lesson
Listen to a student-teacher conversation explaining the topic in a relatable way.
Introduction to Tabulation of Data
🔒 Unlock Audio Lesson
Sign up and enroll to listen to this audio lesson

Today, we're talking about tabulation of data! Can anyone share why they think it's important?

Is it because it helps us organize large amounts of data?
Exactly! Tabulation organizes complex data into a simpler format. It helps us comprehend the information quickly. Think of it like sorting toys; it’s easier to identify your favorite when everything is in neat rows and columns!

What are the key parts of a table?
Great question! A table consists of a number, title, column and row headings, body, units of measurement, source, and notes. Remember, we can use the acronym **T-SCRUC**: Title, Source, Columns, Rows, Units, and Comments.

How does the title help?
The title succinctly describes what the table presents, ensuring readers understand the context immediately.
Can you explain the body of the table more?
Of course! The body contains the actual data. Each entry is positioned by its corresponding row and column heading. It's like a matrix where each box gives specific information.
To summarize today's session, tabulation is crucial for clarity. Remember the acronym T-SCRUC for the main parts of a table!
Types of Classifications in Tabulation
🔒 Unlock Audio Lesson
Sign up and enroll to listen to this audio lesson

Next, let’s discuss types of classifications in tabulation. Who can name one?
There's qualitative classification.
Right! Qualitative classification groups data based on attributes. For instance, types of fruit or gender. What about the other types?
Quantitative classification, because it involves measurable data!
Exactly! Quantitative classifies based on numerical values, like age or height. Then we have temporal and spatial classifications too. Can anyone explain those?

Temporal classification is based on time, while spatial is based on location!
Well done! Using the acronym **QTS** can help remember this—Qualitative, Temporal, Spatial. Remember, each classification guides how we interpret the data.
To recap, we’ve discussed four types of tabulations: qualitative, quantitative, temporal, and spatial, reinforced by our acronym QTS.
Constructing a Table
🔒 Unlock Audio Lesson
Sign up and enroll to listen to this audio lesson
Let’s take a practical approach now. How do we construct a good table?
We start with the title, right?
Yes! The title is the first step. Then, we assign a table number and create our column and row headings. Can anyone share why headings are vital?
They help us identify what each column and row is about!
Exactly! Good headings lead to better understanding. After that, we organize our data in the body and attribute units of measurement. Can we think of an example together?
We could make a table that displays our class's favorite sports!
Great idea! Let’s list each student's name in the rows and the sports in the columns with frequencies. Don’t forget the source and notes at the bottom!
To recap, constructing a table involves title, number, headings, organized body, units, source, and notes. The next time you construct a table, visualize these parts!
Introduction & Overview
Read summaries of the section's main ideas at different levels of detail.
Quick Overview
Standard
The section emphasizes the necessity of organizing voluminous data into tables for clarity and comprehension. It details key components of a table, including titles, column headings, stubs, body, units of measurement, sources, and notes, illustrating their role in enhancing data understanding.
Detailed
Detailed Summary
This section elaborates on the tabulation of data as a method for presenting statistical information effectively. The importance of tabular representation is highlighted, particularly when dealing with large amounts of data that can otherwise be overwhelming in textual form. The text distinguishes between various types of classifications in tabulating data, such as qualitative, quantitative, temporal, and spatial classifications.
A well-constructed table is detailed with essential components:
- Table Number: For easy identification.
- Title: Clear and concise, essential for understanding the table's content.
- Column Headings: Explain what each column represents, aiding comprehension.
- Row Headings (Stubs): Indicate the different categories across the rows.
- Body of the Table: Contains the actual data and should organize it systematically for clarity.
- Units of Measurement: Should be indicated alongside the headings to avoid confusion about the data's scale.
- Source: Indicates where the data is derived from, instilling validity.
- Notes: Include specific explanations about the data presented that aren't self-explanatory.
Additionally, the text emphasizes the advantages of using tables over textual presentations, as they provide a compact, organized view, facilitating further statistical analysis and decision-making.
Youtube Videos


Audio Book
Dive deep into the subject with an immersive audiobook experience.
Introduction to Tabulation
Chapter 1 of 5
🔒 Unlock Audio Chapter
Sign up and enroll to access the full audio experience
Chapter Content
To construct a table, it is important to learn first what are the parts of a good statistical table. When put together systematically these parts form a table. The most simple way of conceptualising a table is to present the data in rows and columns along with some explanatory notes.
Detailed Explanation
Tabulation is a method of presenting data systematically in rows and columns. Rows are the horizontal lines, while columns are the vertical sections. A well-organized table makes the data easy to read and analyze by grouping related items together. This structure helps viewers quickly find and comprehend the information they need.
Examples & Analogies
Imagine trying to find a specific book in a library without any organization; it would be chaotic and time-consuming. Now picture a well-organized library with books arranged by genre, author, and title. Similar to this, a well-tabulated data table provides instant clarity, making it easy for anyone to locate the desired information.
Components of a Table
Chapter 2 of 5
🔒 Unlock Audio Chapter
Sign up and enroll to access the full audio experience
Chapter Content
A good table should essentially have the following: (i) Table number, (ii) Title, (iii) Captions or Column Headings, (iv) Stubs or Row Headings, (v) Body of the Table, (vi) Unit of Measurement, (vii) Source, (viii) Note.
Detailed Explanation
Each component plays a crucial role in understanding the table. The table number and title provide quick identification and context. Captions and stubs represent the data categories horizontally and vertically. The body contains the actual data, while the unit of measurement clarifies how that data is quantified. The source indicates where the data comes from, and notes provide additional explanations or clarifications.
Examples & Analogies
Think of a menu in a restaurant. The title of the menu tells you the theme (like Italian or Mexican), while the table number helps the staff keep track of orders. Each dish's description (column headings) and prices (body) inform customers about what to expect. Just as the menu is essential for a good dining experience, the components of a table are crucial for data presentation.
Types of Classification in Tabulation
Chapter 3 of 5
🔒 Unlock Audio Chapter
Sign up and enroll to access the full audio experience
Chapter Content
Classification used in tabulation is of four kinds: Qualitative, Quantitative, Temporal, and Spatial.
Detailed Explanation
Classification helps categorize data for analysis. Qualitative classification groups data based on attributes like gender or location. Quantitative classification involves measurable data like age or income. Temporal classification considers changes over time, while spatial classification organizes data based on geographic locations. Each type serves a different purpose, depending on the nature of the data.
Examples & Analogies
Consider a sports tournament. Qualitative classification might group teams by their type (football, basketball), while quantitative classification could include scores or player ages. Temporal classification would track performance over tournament rounds, and spatial classification might organize teams by their city. Using these categories helps to analyze performance effectively.
Creating a Table
Chapter 4 of 5
🔒 Unlock Audio Chapter
Sign up and enroll to access the full audio experience
Chapter Content
To create a table, start with identifying the data you want to present. Organize the data into rows and columns, ensuring proper headings and units are clearly defined.
Detailed Explanation
The process of creating a table begins with understanding what data needs to be presented. After gathering the relevant data, it should be formatted into rows (horizontal entries) and columns (vertical entries). Each column requires a clear heading that describes the content, and there should be a clear indication of the measurement units used within the data.
Examples & Analogies
Creating a table is akin to organizing your closet. First, you sort your clothes into categories (shirts, pants, accessories). Next, you arrange them neatly (rows and columns) on hangers, making sure each item is labeled or easily identifiable. Just as a well-organized closet allows you to find and pick outfits quickly, a well-structured table makes data easy to analyze and use.
Example of a Tabulated Data
Chapter 5 of 5
🔒 Unlock Audio Chapter
Sign up and enroll to access the full audio experience
Chapter Content
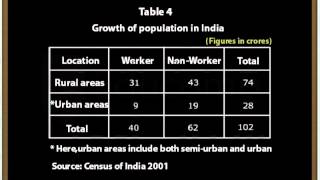
An example of a simple table could be as follows: TABLE 4.5 Population of India according to workers and non-workers by gender and location, 2001.
Detailed Explanation
This example shows how to present complex data in a clear and concise format. The table displays the population totals, split by gender and work status (workers vs. non-workers), which allows for a straightforward comparison of different demographics. Utilizing such a structure can help identify trends or issues within the data.
Examples & Analogies
Think of a classroom attendance chart, where students are listed alongside their attendance status (present, absent). This chart allows the teacher to quickly assess attendance patterns, similar to how a well-constructed table allows for quick data analysis.
Key Concepts
-
Tabulation: Arranging data in rows and columns.
-
Qualitative Classification: Based on attributes.
-
Quantitative Classification: Based on measurable characteristics.
-
Temporal Classification: Based on time.
-
Spatial Classification: Based on location.
-
Body of the Table: Contains actual data.
Examples & Applications
Creating a table of student preferences by surveying favorite subjects.
Tabulating national census data for literacy rates among genders.
Memory Aids
Interactive tools to help you remember key concepts
Rhymes
When data feels heavy and a load, Organize it right, and lighten the road.
Stories
Imagine you have many toys. You can’t find your favorite unless they are sorted neatly in rows and columns. That's tabulation!
Memory Tools
Use T-SCRUC: Title, Source, Column headings, Row headings, Units, Comments to remember a table's parts.
Acronyms
Remember **QTS**
Qualitative
Temporal
Spatial when classifying data.
Flash Cards
Glossary
- Tabulation
The process of arranging data systematically into rows and columns for easy reference.
- Qualitative classification
Categorization of data based on qualities or characteristics, such as sex or location.
- Quantitative classification
Categorization of data based on measurable traits, like age or height.
- Temporal classification
Classifying data based on specific time periods.
- Spatial classification
Classifying data based on geographical locations.
- Body of the table
The section of a table that contains the actual data organized into cells.
Reference links
Supplementary resources to enhance your learning experience.