
Accuracy Assessment and Validation
Enroll to start learning
You’ve not yet enrolled in this course. Please enroll for free to listen to audio lessons, classroom podcasts and take practice test.
Interactive Audio Lesson
Listen to a student-teacher conversation explaining the topic in a relatable way.
Introduction to Accuracy Assessment
🔒 Unlock Audio Lesson
Sign up and enroll to listen to this audio lesson

Today, we will discuss accuracy assessment. Can anyone tell me why accuracy is essential in satellite imagery?

To ensure the results we get from the images are reliable?
Exactly! Accurate data is crucial for making important decisions in fields like urban planning and environmental management. Now, let's explore a key tool used in accuracy assessment called the confusion matrix.

What exactly is a confusion matrix?
A confusion matrix is a table that allows us to visualize the performance of a classification algorithm. It compares the classified data against reference data. Now let's remember this with the acronym CAMEL—Confusion, Accuracy, Metrics, Errors, Labels.

That's a good way to remember it!
To summarize, accuracy is vital, and the confusion matrix helps us understand how well our classifications perform compared to the real data.
Key Metrics of Confusion Matrix
🔒 Unlock Audio Lesson
Sign up and enroll to listen to this audio lesson

Now that we know what a confusion matrix is, let’s break down its components. Who can tell me what overall accuracy means?

Is it the total number of correct classifications divided by the total number of instances?
That’s right! Overall accuracy is a measure of all correctly classified instances. What about the user's accuracy?
It's how many predicted positives are actually positive?
Correct! And producer's accuracy is the opposite, right? It assesses how many actual positives were correctly classified. Remember, you can think of them as: User's accuracy prompts us to ask, 'Of my predictions, how many are correct?' and Producer's accuracy asks, 'Of my true classes, how many did I capture?'
Got it! It's a two-way street.
Well summarized! And lastly, the Kappa coefficient gives us a chance-adjusted measure of agreement. This is essential because it helps us understand if our classification is just random chance or has a real correlation with the data.
Ground Truthing Basics
🔒 Unlock Audio Lesson
Sign up and enroll to listen to this audio lesson
Next, let's discuss ground truthing. Why is it important?
To compare satellite data with what we see on the ground?
Exactly! Ground truthing involves collecting field survey data, often using GPS. It helps validate our class results against real-life information. Think of ground truthing as a reality check for our satellite data!
How do we actually collect this data?
Good question! Field surveys can include visual interpretation, GPS-based data collection, and sometimes even drone imagery for detailed analysis. These collected data points help refine the accuracy of our satellite classifications.
So, without ground truthing, our classifications could be off?
Exactly! In summary, both confusion matrices and ground truthing provide a comprehensive approach to accuracy assessment in satellite imaging, ensuring the data we work with is credible.
Introduction & Overview
Read summaries of the section's main ideas at different levels of detail.
Quick Overview
Standard
In this section, we explore Accuracy Assessment and Validation in satellite image processing. Key methods such as confusion matrices, which outline discrepancies between classified and reference data, are introduced. Additionally, the significance of ground truthing, which validates classification results through field data collection, is emphasized.
Detailed
Accuracy Assessment and Validation
This section focuses on two critical methods for evaluating the accuracy of classified satellite imagery: the confusion matrix and ground truthing. Understanding accuracy assessment is essential for ensuring that the data derived from satellite images can be trusted for real-world applications.
Confusion Matrix
The confusion matrix is a powerful tool displaying the relationship between classified data and reference data. It includes key metrics:
- Overall Accuracy: The percentage of correctly classified instances over the total instances.
- User's Accuracy: Indicates how many of the predicted positive cases are actually positive.
- Producer's Accuracy: Represents how many of the actual positive cases were correctly classified.
- Kappa Coefficient: A statistic that represents the agreement between the classified and reference data beyond chance.
Ground Truthing
This method involves collecting field survey data to verify classification results, often utilizing GPS for precise location data. Ground truthing is crucial for validating and calibrating remote sensing analysis. It helps refine classification methodologies and increase the reliability of satellite imagery interpretation.
In conclusion, the accuracy assessment and validation of satellite images ensure that the processed data is reliable, aiding applications in various fields such as urban planning, agriculture, and environmental monitoring.
Youtube Videos


Audio Book
Dive deep into the subject with an immersive audiobook experience.
Confusion Matrix Overview
Chapter 1 of 2
🔒 Unlock Audio Chapter
Sign up and enroll to access the full audio experience
Chapter Content
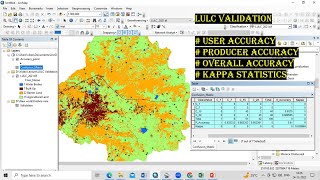
3.6.1 Confusion Matrix
• A table used to compare classified data with reference data.
• Key metrics: Overall Accuracy, User's Accuracy, Producer's Accuracy, Kappa Coefficient.
Detailed Explanation
A confusion matrix is a specific table that helps researchers and analysts understand how well their classification system performed compared to the true or reference data. It allows you to observe the distribution of correct and incorrect predictions made by your classification model. The confusion matrix helps in calculating several important metrics:
- Overall Accuracy measures the proportion of true results (both true positives and true negatives) among the total number of cases examined.
- User's Accuracy indicates how many of the items classified into a specific class by the model are actually correct (reflects the reliability of a classified image).
- Producer's Accuracy reveals how many of the actual instances of a class were correctly identified (reflects the completeness of the classification).
- The Kappa Coefficient provides a measure of agreement between the classification and the reference data, corrected for the possibility of agreement occurring by chance.
Examples & Analogies
Consider a teacher grading exams. The confusion matrix acts like a report card showing how many students scored correctly in different subjects. If the students represent various land types, such as forest, water, or urban areas, the confusion matrix tells the teacher (or analyst) how well the students were understood based on the answers (the classified data) provided against the right answers (the reference data). If a student thinks a water area is urban, the confusion matrix will highlight such errors, allowing the teacher to see where misunderstandings occur.
Ground Truthing Explained
Chapter 2 of 2
🔒 Unlock Audio Chapter
Sign up and enroll to access the full audio experience
Chapter Content
3.6.2 Ground Truthing
• Field survey data used to validate classification results.
• Involves GPS-based data collection and visual interpretation.
Detailed Explanation
Ground truthing is a crucial process in remote sensing and image classification. It involves collecting real-world data from the actual locations on the ground to verify the results produced by satellite images. This validation is essential to ensure that the classifications made by the remote sensing algorithms accurately reflect what exists in reality. Ground truthing often includes using GPS technology to locate specific areas accurately and conducting visual observations or physical surveys that confirm whether those areas are indeed classified as such (e.g., forest, water body, urban area).
Examples & Analogies
Think of ground truthing as checking your homework by visiting a friend's house instead of just using directions from a map. If the satellite imagery indicates that a particular area is forested, ground truthing sends people to that location to see if it actually is a forest. This step builds confidence that what online maps portray is true and helps correct any mistakes in the satellite's classification.
Key Concepts
-
Confusion Matrix: A table used to visualize the performance of a classification algorithm by comparing classified with reference data.
-
Overall Accuracy: The proportion of total correct classifications to the overall instance count.
-
User's Accuracy: The accuracy from the perspective of the predicted positive cases, addressing how many were true positives.
-
Producer's Accuracy: The accuracy from the actual positive cases, assessing how many were correctly classified.
-
Kappa Coefficient: A statistical measure that represents the agreement between classified and reference data beyond chance.
-
Ground Truthing: The verification process that involves field survey data to validate remote sensing classifications.
Examples & Applications
Using a confusion matrix, a land cover classification algorithm can delineate urban areas accurately, leading to a better understanding of city growth patterns compared to raw satellite imagery.
In a project assessing forest cover, ground truthing is conducted by capturing real-time data from forests, enabling validation of whether the classified images correctly identified forested areas.
Memory Aids
Interactive tools to help you remember key concepts
Rhymes
When assessing a class, make no mistake,
Stories
Imagine a detective solving a case; they gather evidence from the field (like ground truthing) to ensure the right suspect was identified, just as we validate our satellite images.
Memory Tools
CAMP for confusion matrix: Count, Analyze, Measure, Predict.
Acronyms
GRAU for ground truthing
Gather
Record
Analyze
Validate
Understand.
Flash Cards
Glossary
- Confusion Matrix
A table used to compare classified data with reference data to evaluate the accuracy of the classification.
- Overall Accuracy
The percentage of correctly classified instances over the total number of instances.
- User's Accuracy
Indicates the proportion of correctly predicted positive cases among all predicted positives.
- Producer's Accuracy
Represents the proportion of correctly classified positive cases among all actual positives.
- Kappa Coefficient
A measure of inter-rater agreement that considers the agreement that could happen by chance.
- Ground Truthing
The process of validating classification results using real-world data collected through field surveys.
Reference links
Supplementary resources to enhance your learning experience.