
Types of Satellite Sensors and Imagery
Enroll to start learning
You’ve not yet enrolled in this course. Please enroll for free to listen to audio lessons, classroom podcasts and take practice test.
Interactive Audio Lesson
Listen to a student-teacher conversation explaining the topic in a relatable way.
Passive and Active Sensors
🔒 Unlock Audio Lesson
Sign up and enroll to listen to this audio lesson

Today, we're diving into the world of satellite sensors! Can anyone tell me the difference between passive and active sensors?

Isn't it that passive sensors rely on natural sources like sunlight?
Exactly! Passive sensors use natural radiation. Examples include optical and thermal infrared sensors. What can you say about active sensors?

Active sensors emit their own signals, like SAR and LiDAR, and then measure the reflected energy.
Great! Remember, Think 'Active equals Action' because they send out energy. Passive sensors, on the other hand, just 'sit and listen'.
So, what would be the practical uses for these sensors?
Good question! Passive sensors are often used in weather monitoring while active sensors are used in terrain mapping and forestry assessments. Any examples of applications you can think of?

SAR can be used for monitoring land deformation after earthquakes.
Perfect example! Let’s recap: Passive sensors use natural radiation, and active sensors emit their own signals. Remember this distinction!
Multispectral and Hyperspectral Imagery
🔒 Unlock Audio Lesson
Sign up and enroll to listen to this audio lesson

Next, let’s explore imagery types. Who can define what multispectral imagery is?

Multispectral imagery captures data in a few specific spectral bands, usually from 3 to 10 bands.
Exactly! An example is Landsat. Now, can anyone explain how hyperspectral imagery differs?
Hyperspectral imagery captures data in hundreds of bands, allowing for detailed analysis and material identification.
Well done! Think of it this way: Multispectral is like a few slices of a pie, while hyperspectral gives you the entire pie. Why might we need hyperspectral data?
It helps us identify different materials like minerals or even plant species more accurately.
Exactly! These advanced spectral capabilities are pivotal in fields like agriculture and environmental monitoring. Let’s wrap up this session with the takeaway: Multispectral for broader data, hyperspectral for detailed identification.
Panchromatic Imagery
🔒 Unlock Audio Lesson
Sign up and enroll to listen to this audio lesson
Lastly, let’s look at panchromatic imagery. What defines this type of image?
Panchromatic imagery is high-resolution and captured in a single band, usually black and white.
Right! It's effective for spatial resolution. How might we enhance images using panchromatic data?
Through pan-sharpening, which combines it with multispectral imagery to improve detail.
Exactly! This technique allows us to merge the strengths of both image types. Now, can anyone think of scenarios where we might prefer panchromatic imagery?
Urban planning, to get clear images of infrastructure!
Spot on! Remember, the clarity of panchromatic imagery is crucial for applications needing detailed terrain analysis. Today, we reviewed sensor types, multispectral vs. hyperspectral imagery, and the role of panchromatic imagery.
Introduction & Overview
Read summaries of the section's main ideas at different levels of detail.
Quick Overview
Standard
The section details various types of satellite sensors, distinguishing between passive sensors, which rely on natural radiation, and active sensors that emit their own signals. It further elaborates on imagery classifications, including multispectral and hyperspectral imagery, along with the characteristics of panchromatic imagery and its applications.
Detailed
Types of Satellite Sensors and Imagery
This section of Chapter 3 expands on the classifications of satellite sensors and the types of imagery they produce, crucial for effective satellite image processing in Geo-Informatics. The discussion flow includes:
3.1.1 Passive and Active Sensors
- Passive Sensors: These sensors depend on natural radiation such as sunlight for detecting and capturing electromagnetic data. Key examples include optical sensors that capture visible light and thermal infrared sensors that measure heat.
- Active Sensors: Unlike passive sensors, active sensors emit their own energy (such as microwave pulses) and measure the energy reflected back. Notable examples include Synthetic Aperture Radar (SAR), which is excellent for surface mapping, and LiDAR, which uses laser light to measure distances with high accuracy.
3.1.2 Multispectral and Hyperspectral Imagery
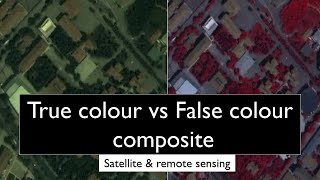
- Multispectral Imagery: This type of imagery captures data across a limited number of spectral bands—typically between 3 to 10 bands. For example, the Landsat satellite collects multispectral data useful for various monitoring applications.
- Hyperspectral Imagery: This captures data in hundreds of contiguous spectral bands, allowing for detailed material identification and classification, exemplified by instruments like Hyperion.
3.1.3 Panchromatic Imagery
- This high-resolution imagery is produced in a single band (usually in grayscale) and is often used for enhancing spatial resolution through techniques such as pan-sharpening, combining it with multispectral data to improve details in the final image.
Youtube Videos


Audio Book
Dive deep into the subject with an immersive audiobook experience.
Passive Sensors
Chapter 1 of 5
🔒 Unlock Audio Chapter
Sign up and enroll to access the full audio experience
Chapter Content
• Passive Sensors: Rely on natural radiation (e.g., sunlight). Examples include optical and thermal infrared sensors.
Detailed Explanation
Passive sensors do not emit any signal on their own. Instead, they rely on natural sources of energy, primarily sunlight, to capture information. These sensors gather data that is reflected or emitted by the Earth's surface. Common examples include optical sensors, which can capture visible light data, and thermal infrared sensors, which detect heat emitted by objects.
Examples & Analogies
Think of passive sensors like a person taking a photograph using natural light. Just as the photographer relies on sunlight to illuminate the scene, passive sensors use sunlight to reflect off surfaces and create images for analysis.
Active Sensors
Chapter 2 of 5
🔒 Unlock Audio Chapter
Sign up and enroll to access the full audio experience
Chapter Content
• Active Sensors: Emit their own signals and measure the reflection. Examples include Synthetic Aperture Radar (SAR) and LiDAR.
Detailed Explanation
Active sensors work by sending out their own signal towards the Earth and measuring the reflections that bounce back. This is different from passive sensors, as the active sensors generate the energy required to take measurements. Synthetic Aperture Radar (SAR) and Light Detection and Ranging (LiDAR) are two common types of active sensors that provide information about the Earth's surface, including its shape and structure. They are particularly useful in environments where natural light is not available.
Examples & Analogies
Imagine sending out a sonar signal underwater. Just as the sonar sends out a sound wave and listens for the echo to determine the distance and shape of objects, active sensors emit signals and analyze the returned signals to gather data about the Earth's surface.
Multispectral Imagery
Chapter 3 of 5
🔒 Unlock Audio Chapter
Sign up and enroll to access the full audio experience
Chapter Content
• Multispectral Imagery: Captures data in 3 to 10 spectral bands. Example: Landsat.
Detailed Explanation
Multispectral imagery refers to the capability of sensors to capture image data across multiple spectral bands in the electromagnetic spectrum, typically between three and ten bands. Each band captures different wavelengths, allowing for the discernment of various features on the Earth's surface such as vegetation, water, and built environments. Landsat, a widely utilized satellite, is an example of a program that employs multispectral sensors.
Examples & Analogies
Think of multispectral imagery like how a painter uses different colors on a canvas. Each color captures unique aspects of the scene, just as different spectral bands capture various features, enabling a detailed representation of the landscape.
Hyperspectral Imagery
Chapter 4 of 5
🔒 Unlock Audio Chapter
Sign up and enroll to access the full audio experience
Chapter Content
• Hyperspectral Imagery: Captures data in hundreds of contiguous bands, enabling detailed material identification. Example: Hyperion.
Detailed Explanation
Hyperspectral imagery is a more advanced type of remote sensing that involves capturing data in a much larger number of spectral bands - often hundreds. This allows the sensors to identify materials based on their spectral signatures with great precision. For instance, individual minerals can be distinguished based on the specific wavelengths they reflect or absorb. The Hyperion sensor is a notable example that uses this technology to aid in environmental monitoring and resource management.
Examples & Analogies
Hyperspectral imagery can be likened to having a very detailed and specific color palette, where each color represents a unique material. Just as an artist can create different shades by blending colors, hyperspectral sensors can differentiate between materials by analyzing their spectral responses in a much finer way.
Panchromatic Imagery
Chapter 5 of 5
🔒 Unlock Audio Chapter
Sign up and enroll to access the full audio experience
Chapter Content
• Panchromatic Imagery: High-resolution, single-band imagery in black and white, often used for enhancing spatial resolution through pan-sharpening.
Detailed Explanation
Panchromatic imagery is characterized by high-resolution images that capture data in a single spectral band, typically in the visible spectrum, and is presented in black and white. This type of image is useful in various applications due to its high spatial resolution, which provides detailed views of the landscape. It is often combined with multispectral imagery in a process called pan-sharpening to enhance the spatial detail of color images.
Examples & Analogies
You can think of panchromatic imagery as a highly detailed black-and-white photograph. Just like a photo that captures intricate details in shades of grey can still tell a story, panchromatic images provide valuable insights into the landscape, offering clarity that can be enhanced when combined with the color attributes of multispectral images.
Key Concepts
-
Passive Sensors: Sensors that gather data from natural radiation.
-
Active Sensors: Sensors that emit signals to capture reflected data.
-
Multispectral Imagery: Captures limited spectral bands for monitoring.
-
Hyperspectral Imagery: Detailed spectral data capturing for material identification.
-
Panchromatic Imagery: High-resolution imagery in a single band, often enhancing other types.
Examples & Applications
Landsat satellite uses multispectral imagery for vegetation monitoring.
SAR technology is used for detecting surface deformations after an earthquake.
Panchromatic imagery provides clear views of urban infrastructures.
Memory Aids
Interactive tools to help you remember key concepts
Rhymes
In the sky, sensors comply, Passive's the sun, no need to buy. Active sends out, signals bright, Take back what’s shown, data in sight.
Stories
Imagine a photographer (passive sensor) who waits for natural light to capture landscapes, while another photographer (active sensor) has a flash that lights up scenes in the dark to capture details.
Memory Tools
PAVE: Passive and Active, Visual and Effective - to remember types of sensors.
Acronyms
MHH
Multispectral captures a Few
Hyperspectral hundreds for you.
Flash Cards
Glossary
- Passive Sensors
Sensors that rely on natural radiation for data acquisition, such as sunlight.
- Active Sensors
Sensors that emit their own signals to measure the energy reflected from objects.
- Multispectral Imagery
Imagery that captures data across a limited number of spectral bands, typically 3 to 10.
- Hyperspectral Imagery
Imagery that captures data in hundreds of contiguous spectral bands, facilitating detailed analysis.
- Panchromatic Imagery
High-resolution imagery captured in a single spectral band, typically in black and white.
Reference links
Supplementary resources to enhance your learning experience.