
Change Detection and Time-Series Analysis
Enroll to start learning
You’ve not yet enrolled in this course. Please enroll for free to listen to audio lessons, classroom podcasts and take practice test.
Interactive Audio Lesson
Listen to a student-teacher conversation explaining the topic in a relatable way.
Introduction to Change Detection Techniques
🔒 Unlock Audio Lesson
Sign up and enroll to listen to this audio lesson

Today, we are diving into change detection techniques. Does anyone know why detecting changes in satellite images is important?

It helps us understand land use changes over time!
Great! Let's explore the first technique: post-classification comparison. Who can explain what it involves?

It compares classified images from different dates!
Exactly! This technique is beneficial as it helps us see how different areas have changed. Can anyone give an example of this?

Maybe to see urban expansion?
Yes! Urban expansion is a common use-case. Now, let's look at **Image Differencing**. Can someone summarize what that technique is?

It's when we subtract pixel values from two images taken at different times!
Perfect! This highlights the areas that have changed drastically. To remember this method, think of it as 'differencing' – you're finding the difference! By using acronyms like D for differing values, it can aid our memory! Let's move on to **Change Vector Analysis**. What distinguishes this one from the others?
It detects both the magnitude and the direction of change!
Correct! The ability to capture the direction is what makes CVA significant for understanding the dynamics of land cover changes.
To summarize, we learned how post-classification comparison compares different classifications, image differencing highlights changes by subtraction, and CVA captures both the magnitude and the direction of change.
Understanding Time-Series Analysis
🔒 Unlock Audio Lesson
Sign up and enroll to listen to this audio lesson

Now that we’ve covered change detection, let’s discuss time-series analysis. Can anyone explain what this concept is?
Is it tracking changes over time using a series of images?
Yes! It’s perfect for monitoring land cover or vegetation changes. Why do you think tracking these changes is useful?
It can help detect trends, like deforestation or urban sprawl.
Exactly! For instance, if we see urban sprawl in a time series in a city, we can conclude that population growth is impacting land use. What are some other applications of time-series analysis?
It could be used in agriculture to monitor crop health over time.
Right! Monitoring crop health through regular observations can indicate yield outcomes. By employing time-series analysis, we can implement timely interventions. Remember, time-series analysis allows us to not only track current conditions but also identify long-term trends and anomalies, which is crucial for informed decisions.
To wrap up, time-series analysis is valuable for understanding the patterns over time and can provide critical support in various domains including environmental monitoring and disaster management.
Introduction & Overview
Read summaries of the section's main ideas at different levels of detail.
Quick Overview
Standard
Change detection techniques play a crucial role in satellite imagery analysis by allowing comparisons between multiple time points. This section discusses different methods such as post-classification comparison and change vector analysis, along with the significance of time-series analysis in tracking land cover changes and identifying trends over time.
Detailed
Change Detection and Time-Series Analysis
Change detection and time-series analysis are essential aspects of satellite image processing that enable the monitoring of changes in land cover and vegetation over time. The section begins by outlining several change detection techniques:
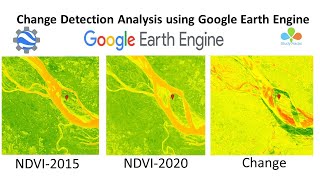
1. Post-classification Comparison: This method involves a comparison of classified images from different dates to identify changes in land use or cover types.
2. Image Differencing: By subtracting pixel values from images taken at different times, this method highlights areas of change.
3. Change Vector Analysis (CVA): CVA detects both the magnitude and direction of change, providing a more nuanced understanding of modifications over time.
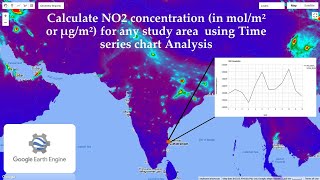
The section further elaborates on time-series analysis, emphasizing its role in tracking changes over time using a sequence of satellite images. It highlights its utility in trend analysis and anomaly detection, essential for various applications such as urban development, agricultural monitoring, and natural disaster assessment. By combining the methodologies of change detection and time-series analysis, practitioners can derive insightful conclusions from satellite data, enabling effective decision-making and environmental management.
Youtube Videos


Audio Book
Dive deep into the subject with an immersive audiobook experience.
Change Detection Techniques
Chapter 1 of 2
🔒 Unlock Audio Chapter
Sign up and enroll to access the full audio experience
Chapter Content
3.7.1 Change Detection Techniques
• Post-classification Comparison: Compares classified images from two different dates.
• Image Differencing: Subtracts pixel values from two temporal images.
• Change Vector Analysis (CVA): Detects magnitude and direction of change.
Detailed Explanation
Change detection techniques are methods used to identify differences in the state of an object or phenomenon by observing it at different times. The three primary techniques are:
- Post-Classifictaion Comparison: This approach involves classifying satellite images taken at two different times and then comparing the classifications to see how areas have changed. For example, if a forest area is classified as 'forest' in one image and 'urban' in another, we can see that development has occurred.
- Image Differencing: In this method, we subtract the pixel values of the two images from each other. The result reveals how much change has occurred in terms of intensity. For example, if an area becomes much darker or lighter in a comparison, that indicates a significant change, like deforestation or urbanization.
- Change Vector Analysis (CVA): This technique not only detects that change happened, but also identifies the direction and magnitude of that change. It uses a mathematical model to analyze how pixel values have shifted and can help understand processes affecting land cover, such as agriculture expansion or mining.
Examples & Analogies
Imagine you are a gardener and you take photos of your garden every season. By comparing your summer photo to your winter photo (using post-classification comparison), you can see where flowers bloomed and where they died. Image differencing is like looking at how many leaves turned yellow or how many flowers are missing – you can measure that change numerically. Change Vector Analysis would be like noting not just the fact that some flowers died, but how much less vibrant your garden looks now compared to summer, allowing you to understand if some areas need more care or nutrients.
Time-Series Analysis
Chapter 2 of 2
🔒 Unlock Audio Chapter
Sign up and enroll to access the full audio experience
Chapter Content
3.7.2 Time-Series Analysis
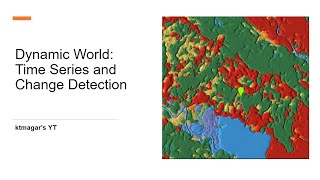
• Tracks land cover or vegetation changes over time using a sequence of satellite images.
• Enables trend analysis and anomaly detection.
Detailed Explanation
Time-series analysis in the context of satellite imagery involves collecting and analyzing a series of images of the same area over time to observe changes that occur. Here’s how it works:
- Tracking Changes: By acquiring satellite images at regular intervals, scientists and researchers can track changes in land cover, vegetation, or even urban development. This can be as simple as looking at a city’s expansion or monitoring a forest's health.
- Trend Analysis: This technique allows researchers to identify patterns over time. For instance, if a particular region is gradually losing vegetation, the collected data over several years can illustrate this trend, highlighting environmental concerns.
- Anomaly Detection: Time-series analysis can also help in identifying unusual changes, such as a sudden increase in water levels in a river or a rapid deforestation event. These anomalies can prompt further investigation or intervention, helping to tackle environmental issues quickly.
Examples & Analogies
Think of time-series analysis like keeping a diary of your weight. If you weigh yourself once a month, you can track whether you've lost or gained weight over time. You might notice that in the summer, you lose weight consistently, but suddenly, in winter, you gain a lot more. In satellite imagery, it's similar; you can track a forest's health over the years, seeing periods of growth or decline, and identify particularly concerning years when deforestation spikes.
Key Concepts
-
Change Detection: Techniques used to identify changes in satellite imagery.
-
Time-Series Analysis: A method for tracking changes over time using a series of satellite images.
-
Post-classification Comparison: A technique comparing classified images from different dates.
-
Image Differencing: A method of subtracting pixel values from two images to highlight changes.
-
Change Vector Analysis: A technique to assess both the magnitude and direction of changes.
Examples & Applications
A city uses post-classification comparison to demonstrate how industrial zones have expanded into agricultural areas over the past decade.
Using time-series analysis, a researcher tracks the seasonal changes in vegetation cover across multiple seasons.
Memory Aids
Interactive tools to help you remember key concepts
Rhymes
To find the change, look at the range, those pixels may seem strange.
Stories
Imagine a farmer checking his crops year after year. Using time-series analysis, he notes how the changing seasons affect his harvest, helping him make better decisions.
Memory Tools
To remember CVA, think of 'Change Vector Analysis: Change is in the direction and the size too!'
Acronyms
Use the acronym PCA; Post-classification Comparison Allows you to see the differences!
Flash Cards
Glossary
- Change Detection
The process of identifying differences in the state of an object or phenomenon by observing it at different times.
- TimeSeries Analysis
A method used to analyze time-ordered data points to identify trends, cycles, and anomalies.
- Postclassification Comparison
A technique that compares classified images from different time periods to detect changes.
- Image Differencing
A process that subtracts pixel values from two different images to highlight the changes.
- Change Vector Analysis (CVA)
A method that assesses the magnitude and direction of change in multi-temporal data.
Reference links
Supplementary resources to enhance your learning experience.