
Post-Processing and Data Analysis
Enroll to start learning
You’ve not yet enrolled in this course. Please enroll for free to listen to audio lessons, classroom podcasts and take practice test.
Interactive Audio Lesson
Listen to a student-teacher conversation explaining the topic in a relatable way.
Data Transfer Methods
🔒 Unlock Audio Lesson
Sign up and enroll to listen to this audio lesson

Today, we'll learn about how we transfer data collected from a Total Station. Can anyone tell me why transferring data accurately is important?

It’s important so we don’t lose any information collected in the field.
Exactly! We can transfer data using USB, SD cards, or even wirelessly. Remember the acronym USB - *Ubiquitous Survey Backup*! What do you think happens if we forget this step?

We might lose our measurements and have to redo the survey!
Precisely. Now let's discuss what happens after we transfer the data.
Output Generation
🔒 Unlock Audio Lesson
Sign up and enroll to listen to this audio lesson

Finally, let’s explore the types of outputs we can produce. What do we create from the processed data?
Topographic maps and digital terrain models!
Correct! Remember the acronym MAP - *Modeling All Points*. How do overall outputs impact civil engineering projects?
They allow engineers to visualize the land and plan accordingly.
Exactly! Visual outputs aid tremendously in planning and decision-making. Let’s summarize our key points about post-processing.
Introduction & Overview
Read summaries of the section's main ideas at different levels of detail.
Quick Overview
Standard
This section elaborates on the steps involved in post-processing and data analysis of survey data collected by Total Stations. It covers data transfer methods, software utilized for processing, and the types of output documents generated, such as topographic maps and digital models.
Detailed
Post-Processing and Data Analysis
Post-processing and data analysis are crucial steps in the surveying workflow following data acquisition from Total Stations. The process begins with data transfer from the field to a computer, ensuring that all angles, distances, and timestamps collected are accurately transferred using methods like USB, SD card, or wireless transmission.
Once the data is on a computer, specialized processing software is employed. The software performs various calculations, including traverse adjustment, spot height interpolation, and contour generation, which are fundamental for transforming raw survey data into usable formats. Commonly used software includes applications like AutoCAD Civil 3D, MicroSurvey STAR*NET, and Surfer for GIS integration.
Finally, the processed data is utilized to create significant output formats. The outputs can include:
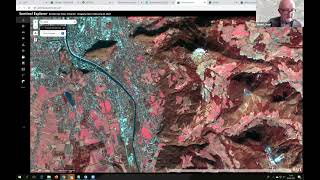
- Topographic maps, which depict elevation changes across a terrain.
- Alignment drawings, crucial for construction projects.
- Digital Terrain Models (DTMs) that provide a three-dimensional view of the area surveyed.
- Cross-sections and longitudinal profiles, which help in understanding the land contours.
This section emphasizes the importance of software tools and output generation to enhance the accuracy and usability of survey data, making it essential for civil engineering projects and geospatial analyses.
Youtube Videos


Audio Book
Dive deep into the subject with an immersive audiobook experience.
Data Transfer
Chapter 1 of 3
🔒 Unlock Audio Chapter
Sign up and enroll to access the full audio experience
Chapter Content
- Transfer field data to a computer using USB, SD card, or wireless transfer.
- Use manufacturer software (e.g., Leica Geo Office, Trimble Business Center).
Detailed Explanation
In the first step of post-processing, surveyors need to move the data collected in the field to a computer. This can be done through various methods such as using a USB flash drive, an SD card, or through a wireless connection. Once transferred, the next step involves using specific software designed for surveying tasks to manage and analyze the data.
Examples & Analogies
Think of this step like taking photos on a camera and then transferring them to your computer to edit. Just as you wouldn’t start editing your photos on the camera screen, surveyors need to move their data to more advanced software to do detailed analyses.
Processing Software
Chapter 2 of 3
🔒 Unlock Audio Chapter
Sign up and enroll to access the full audio experience
Chapter Content
- Perform computations of:
- Traverse adjustment
- Spot height interpolation
- Contour generation
- Commonly used software includes:
- AutoCAD Civil 3D
- MicroSurvey STAR*NET
- Surfer, QGIS for GIS integration.
Detailed Explanation
After the data has been moved to the computer, the next step is processing it with specialized software. This software can perform several important functions such as adjusting any errors in the measurements (traverse adjustment), generating spot heights at various points (spot height interpolation), and creating contour lines that represent the terrain (contour generation). Some widely used software options include AutoCAD Civil 3D and QGIS, which are popular in civil engineering for their data visualization and mapping capabilities.
Examples & Analogies
Imagine preparing raw ingredients for a recipe. You need to chop, measure, and mix them before you can actually cook a meal. Similarly, processing data involves organizing and refining it before any useful results, like maps or models, can be produced.
Output Generation
Chapter 3 of 3
🔒 Unlock Audio Chapter
Sign up and enroll to access the full audio experience
Chapter Content
- Create:
- Topographic maps
- Alignment drawings
- Digital Terrain Models (DTMs)
- Cross-sections and longitudinal profiles.
Detailed Explanation
Lastly, once the data is processed, the results are outputted into various forms. These outputs can include topographic maps that show the elevations and contours of the land, alignment drawings for construction projects, digital terrain models that simulate the landscape in digital form, and cross-sections and profiles which provide detailed views of specific sections of the terrain. Each output serves specific purposes in planning and design.
Examples & Analogies
Consider a sculptor who chisels a block of marble. After the rough shaping is done, the final product can take various forms like a statue or a relief. Each form conveys different messages and serves different aesthetics, just like the various outputs from surveying data serve different practical applications in civil engineering and construction.
Key Concepts
-
Data Transfer: Moving field data to processing software.
-
Processing Software: Tools for managing and analyzing survey data.
-
Output Generation: Creation of reports and maps from processed data.
Examples & Applications
Using AutoCAD Civil 3D to create a digitally accurate topographic map.
Generating a DTM from survey data for planning a new construction project.
Memory Aids
Interactive tools to help you remember key concepts
Rhymes
To process well, don’t fear the task, just transfer and map, that’s all you ask!
Stories
Imagine a surveyor collecting data, she then transfers it to her computer. With her software, she creates beautiful maps that help in building new roads and parks.
Memory Tools
Remember 'DPO' - Data Transfer, Processing, Output!
Acronyms
MAP - Modeling All Points ensures we visualize data accurately.
Flash Cards
Reference links
Supplementary resources to enhance your learning experience.