
Bode Plot Introduction
Enroll to start learning
You’ve not yet enrolled in this course. Please enroll for free to listen to audio lessons, classroom podcasts and take practice test.
Interactive Audio Lesson
Listen to a student-teacher conversation explaining the topic in a relatable way.
Introduction to Frequency Response
🔒 Unlock Audio Lesson
Sign up and enroll to listen to this audio lesson

Today, we'll start by discussing frequency response. Can anyone tell me what we mean by frequency response?

Is it how an amplifier responds to different frequency signals?
Exactly right! Frequency response examines how an amplifier's gain changes with frequency. It's crucial for understanding performance across various signals.

So, does that mean different frequencies have different effects on signal strength?
Yes, exactly! We measure these changes using Bode plots. Remember, frequency response lets us visualize how amplifiers handle different signal frequencies.
Understanding Transfer Functions
🔒 Unlock Audio Lesson
Sign up and enroll to listen to this audio lesson

Next, let’s talk about transfer functions. Can anyone explain what a transfer function is?

Isn't it a mathematical description of how input signals are transformed into output signals?
Correct! Specifically, we often move from the Laplace domain to the frequency domain by substituting s with jω.

So, by substituting, we can analyze how the circuit behaves at different frequencies?
Absolutely! Each variation in frequency reveals insights about gain and phase shift—which will be crucial for our Bode plot discussions.
Magnitude and Phase Characteristics
🔒 Unlock Audio Lesson
Sign up and enroll to listen to this audio lesson
Now, let’s dive deeper into magnitude and phase characteristics. How do you think these two are related to frequency?
I assume they change as frequency changes? Like, certain frequencies might attenuate the signal more?
Precisely! Magnitude indicates how much the signal strength changes, while phase shows the timing shifts. How do you think we visualize these changes?
Is it through Bode plots, showing gain in decibels and phase in degrees?
Exactly! Bode plots help us see these relationships more clearly over a wide frequency range.
Cutoff Frequencies and Poles
🔒 Unlock Audio Lesson
Sign up and enroll to listen to this audio lesson
Let’s discuss cutoff frequencies and their significance. What can you tell me about them?
Aren't cutoff frequencies where the circuit starts to attenuate signals?
Yes, they mark the transition point! They often correlate with poles in the system’s transfer function, which can also indicate stability.
So, if we identify the poles, we can determine where the amplifier may not operate effectively?
Absolutely! Identifying poles is key to understanding an amplifier's frequency limitations. Always remember the relationship between transfer functions and frequency response!
Constructing Bode Plots
🔒 Unlock Audio Lesson
Sign up and enroll to listen to this audio lesson
Finally, let's talk about constructing Bode plots. Why do you think we use logarithmic scales for frequency?
It helps us manage the wide range of frequencies better, right?
Exactly! Logarithmic scales allow us to fit both low and high frequencies on the same plot. What about the gain?
We convert it to decibels for better visualization?
Correct again! This way, we can clearly see how the amplifier behaves across a broad spectrum, making it easier to analyze and design circuits.
Introduction & Overview
Read summaries of the section's main ideas at different levels of detail.
Quick Overview
Standard
The section covers the fundamentals of Bode plots, highlighting their utility in representing the gain and phase of electronic circuits. It details the transformation of transfer functions from the Laplace domain to the frequency domain, the significance of cutoff frequencies, and the concept of poles in transfer functions, all of which play a critical role in analyzing circuit behavior over a range of frequencies.
Detailed
Bode Plot Introduction
Bode plots are critical tools in electrical engineering for analyzing the frequency response of electronic circuits, particularly amplifiers like common emitter (CE) and common source (CS) configurations. This section delves into how Bode plots are constructed and the insights they provide into circuit behavior.
Key Points Covered:
- Frequency Response: Understanding how the gain of circuits varies with frequency, marking the transition from low to high frequencies.
- Transfer Functions: The transformation from the Laplace domain to the frequency domain (using the substitution s = jω), allowing for the analysis of circuit dynamics.
- Magnitude and Phase Behavior: The analysis of the output-to-input ratio in terms of both magnitude and phase, showcasing how these characteristics evolve in response to frequency changes.
- Cutoff Frequencies and Poles: Discussing cutoff (or corner) frequencies where circuit behavior transitions—typically identified by the location of poles in the transfer function.
- Bode Plot Construction: Covering the significance of using logarithmic scales for both the frequency axis and the gain axis to effectively capture the wide range of circuit behavior across frequencies, thus enabling clearer visualizations and interpretations of circuit dynamics.
This knowledge is vital as it forms the foundation for understanding amplifier designs, filtering processes, and overall circuit performance in various applications.
Youtube Videos

Audio Book
Dive deep into the subject with an immersive audiobook experience.
Overview of Bode Plot
Chapter 1 of 5
🔒 Unlock Audio Chapter
Sign up and enroll to access the full audio experience
Chapter Content
This Bode plot is as I said basically this is a gain plot and phase plot, but instead of gain or you can say magnitude of the transfer function it is 20 log .
Detailed Explanation
A Bode plot is a graphical representation of a linear time-invariant system. It combines two plots: one for amplitude (gain) and one for phase as a function of frequency, typically in a logarithmic scale. The gain plot represents how the output signal's magnitude responds to varying input frequencies, while the phase plot shows the phase shift that occurs at those frequencies.
Examples & Analogies
Think of tuning a musical instrument. As you adjust the tension of a guitar string (frequency), the pitch (gain) changes. A Bode plot would show how the quality of sound (amplitude) and how it feels (phase) are affected as you twist the tuning pegs.
Axes of the Bode Plot
Chapter 2 of 5
🔒 Unlock Audio Chapter
Sign up and enroll to access the full audio experience
Chapter Content
Note that in this is in log scale. So, once say this is in log scale; obviously, we cannot reach to the 0 frequency, we may be starting with some +ve frequency.
Detailed Explanation
In a Bode plot, the x-axis (frequency) is plotted on a logarithmic scale, allowing a wide range of frequencies to be displayed. This is important because electronic systems often deal with a vast range of frequencies. The y-axis is typically the gain in decibels (dB), which is a logarithmic measure of the ratio of output to input. Because it cannot equate to zero frequency directly in logarithmic terms, it starts from some small positive value.
Examples & Analogies
Imagine measuring the height of people in a city. If you use a standard ruler, you can only measure heights from 0 up. But, if you use a logarithmic scale, you can represent very short and very tall people together in a more easily readable format. Similarly, Bode plots help visualize both extremely low and extremely high frequencies clearly.
Gain and Phase Changes in Bode Plot
Chapter 3 of 5
🔒 Unlock Audio Chapter
Sign up and enroll to access the full audio experience
Chapter Content
So, if it is say this is maybe say 0 dB or maybe ‒ this 1 is maybe say 20 dB, ‒20 dB and this may be say ‒10 dB, this may be 0 dB and so and so.
Detailed Explanation
The gain levels on the Bode plot are measured in decibels (dB), which provide a logarithmic scale for amplitude. A gain of 0 dB means the output is equal to the input. Negative dB values indicate attenuation, where the output signal is weaker than the input. In contrast, phase values, which may range from 0° to 360°, illustrate how the output signal's timing shifts in relation to the input as frequency varies.
Examples & Analogies
Consider a speaker playing music. When set to 0 dB, the sound volume matches the original track. If you turn it down to -10 dB, the music is quieter. The phase Shift could be imagined as a dance where the dancers (signal) are out of sync with the music (input), making it feel awkward depending on how they move together.
Frequency Response Characteristics
Chapter 4 of 5
🔒 Unlock Audio Chapter
Sign up and enroll to access the full audio experience
Chapter Content
So, this graph it is referred as semi log graph paper where x-axis is in log scale, y-axis it is in linear scale.
Detailed Explanation
By using a semilog graph for the Bode plot, engineers can clearly observe the system’s response across a wide frequency range without distortion. The x-axis is logarithmic, which compresses the values and gives more visibility to changes in low frequencies, while the y-axis is linear, showing the actual gain value directly. This structure allows for simplification of complex frequency response data.
Examples & Analogies
Imagine measuring a slow-growing plant. Using a standard ruler may make its growth hard to track as it only inches forward each week. However, if you plot growth on a logarithmic scale, even tiny increments become noticeable, making it easier to visualize and understand its overall development over time.
Cut-off Frequency and Behavior
Chapter 5 of 5
🔒 Unlock Audio Chapter
Sign up and enroll to access the full audio experience
Chapter Content
So, for C-R circuit we can say that cutoff frequency it is, in case if the frequency it is expressed in rad/sec.
Detailed Explanation
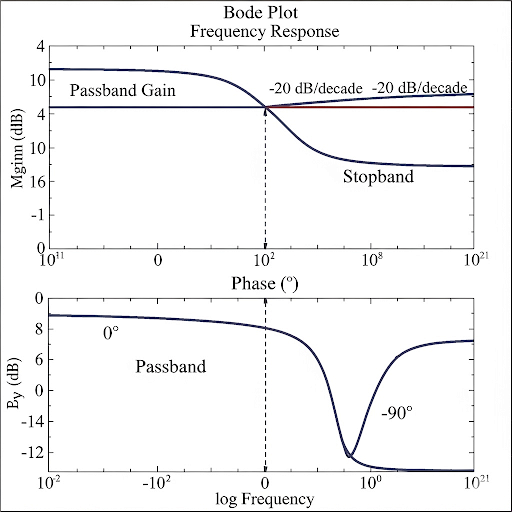
The cut-off frequency in a Bode plot indicates the point where the output signal starts to significantly decrease in relation to the input signal. This frequency marks the boundary between passband (where signals are allowed) and stopband (where signals are attenuated). Beyond this frequency, the circuit starts behaving like a filter, significantly reducing the signal's amplitude. This is an important concept for designing and understanding circuits.
Examples & Analogies
Think of a filter in your kitchen sink. Water flows through easily (passband) until you reach a specific point where the mesh of the filter becomes so fine that larger food particles cannot pass through (stopband). The cut-off frequency in electronics similarly signifies where signals can no longer effectively pass through the system.
Key Concepts
-
Frequency Response: How the output of a circuit changes based on the input frequency.
-
Bode Plots: A graphical way to show the gain and phase shift of a system over frequency.
-
Transfer Function: A mathematical expression defining the relationship between input and output of a circuit.
-
Cutoff Frequency: The frequency at which the gain drops to a specified level, typically –3 dB.
-
Poles: Critical points in the transfer function that help determine the frequency characteristics of a circuit.
Examples & Applications
An example of a Bode plot showing a common emitter amplifier that indicates the frequency response of the circuit.
Analyzing data from a transfer function that includes both the magnitude and phase response against frequency.
Memory Aids
Interactive tools to help you remember key concepts
Rhymes
To plot and see what circuits do, Bode plots will help you through!
Stories
Imagine a canyon, the sound travels far; at different heights (frequencies), it echoes like a star. Some echoes fade (cutoff), while others roar; the Bode plot shows you which ones soar!
Memory Tools
Remember: 'Bode' - Block Over Different Energies' to remind you of the frequency dynamics.
Acronyms
Think of the acronym 'FCT' for Frequency, Cutoff, and Transfer function, the three pillars of our analysis!
Flash Cards
Glossary
- Bode Plot
A graphical representation of a system’s frequency response that shows magnitude and phase against frequency on a logarithmic scale.
- Frequency Response
The measurement of an amplifier's output as a function of input frequency.
- Transfer Function
A mathematical representation in the Laplace domain that describes the input-output relationship of a system.
- Cutoff Frequency
The frequency at which the output power falls to half its value (–3 dB point) from the maximum value in frequency response.
- Pole
A value in the s-domain where the transfer function becomes infinite, indicating important frequency characteristics.
Reference links
Supplementary resources to enhance your learning experience.