
Revisiting Frequency Response of R-C and C-R Circuits
Enroll to start learning
You’ve not yet enrolled in this course. Please enroll for free to listen to audio lessons, classroom podcasts and take practice test.
Interactive Audio Lesson
Listen to a student-teacher conversation explaining the topic in a relatable way.
Basic Concepts of R-C and C-R Circuits
🔒 Unlock Audio Lesson
Sign up and enroll to listen to this audio lesson

Welcome, students! Today, we're diving into the frequency response of R-C and C-R circuits. Can anyone tell me what an R-C circuit is?

It's a circuit that contains a resistor and a capacitor.
Correct! And what about a C-R circuit?

That's a circuit with a capacitor and a resistor, but the capacitor is the first element.
Exactly! Now let's discuss how these circuits behave as we change the frequency of the input signal. Why do you think frequency matters?

I guess it affects how quickly the capacitor charges and discharges?
Great insight! The frequency influences the impedance of the capacitor, which directly affects the overall circuit behavior.

So, are we going to look at how the gain changes with frequency?
Yes! The gain changes, and we can use transfer functions to analyze this behavior. Let's remember it with the acronym GAIN: Gain Analysis of Input Frequencies.
In our next session, we will explore how we derive the transfer function in the Laplace domain.
Using Laplace Transform for Analysis
🔒 Unlock Audio Lesson
Sign up and enroll to listen to this audio lesson

In this session, we will utilize the Laplace transform to analyze our R-C and C-R circuits. Who can remind us what the Laplace transform does?
It converts time-domain signals into frequency-domain signals.
Correct! To find the transfer function, we represent the circuit in the Laplace domain. For an R-C circuit, how do we represent the impedances?
The resistor is R and the capacitor is represented by 1/(sC) in the Laplace domain!
Exactly! The transfer function will then be the output across the resistor over the input voltage. Can anyone express this relationship mathematically?
It’s V(s) = R * I(s) / (R + 1/(sC))!
Nicely done! Simplify this expression to find the transfer function for our circuit.
After simplification, I get V(s) = sCR / (1 + sCR).
Perfect! This transfer function tells us how the output voltage responds to different input frequencies. Let’s move on to applying this function to understand the frequency response.
Understanding Frequency Response and Poles
🔒 Unlock Audio Lesson
Sign up and enroll to listen to this audio lesson
Now that we have our transfer function, let’s talk about frequency response. Who can tell me what we mean by this term?
It describes how the output varies with the frequency of the input signal.
Exactly! Frequency response gives us significant insights. How does the concept of poles and zeros play into this?
Poles in the transfer function can indicate where the output gains drop off, while zeros can show where the gain rises.
Right again! The cut-off frequency can be found at the location of these poles. If we equate the denominator of our transfer function to zero, what do we find?
We find the cut-off frequency, where the circuit starts to attenuate the signal.
Excellent! Let’s remember this with the mnemonic POLAR: Poles Indicate where Output Loss Occurs. Next, we’ll plot the frequency response to visualize this.
Plotting Bode Plots for Circuit Analysis
🔒 Unlock Audio Lesson
Sign up and enroll to listen to this audio lesson
We’re nearing the end of our discussion on frequency response. Bode plots are essential for visualizing the response of circuits. Can someone explain what a Bode plot represents?
They show the gain and phase shift plotted against a logarithmic scale of frequency.
Exactly! This allows us to observe circuit behavior over a wide frequency range without distortion. Why do you think we use a logarithmic scale?
It helps to manage the vast differences in frequency ranges, like going from Hz to GHz.
Well said! When we lay out a Bode plot, we will plot gain in decibels. What’s the conversion from ratio to dB?
We use 20 log10 of the voltage gain.
That's correct! The use of decibels allows for clearer interpretation of gain. Let’s recap our main takeaways from Bode plots.
Introduction & Overview
Read summaries of the section's main ideas at different levels of detail.
Quick Overview
Standard
The section provides an in-depth explanation of frequency response in R-C and C-R circuits, exploring how varying frequencies influence the gain and behavior of these circuits. It introduces concepts like Laplace transform, transfer functions, and Bode plots, highlighting their relevance in circuit analysis.
Detailed
Revisiting Frequency Response of R-C and C-R Circuits
This section covers the essentials of the frequency response in R-C (resistor-capacitor) and C-R (capacitor-resistor) circuits. These circuits play a critical role in determining how signals are processed based on their frequency. The discussion begins with a review of the basic characteristics of both R-C and C-R circuits. It emphasizes the use of the Laplace domain for circuit analysis, explaining how input and output transfers are evaluated.
Key points include the transfer function, which reveals how output voltage changes in relation to input voltage as frequency varies. The significance of poles and zeros in the transfer function is highlighted, particularly regarding their relation to cut-off frequency and system behavior. Furthermore, the section introduces the concept of presenting frequency response data using Bode plots, which are preferred for their log-scaled representation, allowing for easier interpretation across wide frequency ranges. The transition between different frequency behaviors, notably from high-pass to low-pass characteristics, is also discussed, setting a foundation for understanding more complex amplifier circuits in subsequent lessons.
Youtube Videos

Audio Book
Dive deep into the subject with an immersive audiobook experience.
Introduction to R-C and C-R Circuits
Chapter 1 of 5
🔒 Unlock Audio Chapter
Sign up and enroll to access the full audio experience
Chapter Content
And, to start with let we go with C-R circuit. So, the C-R circuit is given here, the input we are applying across the series connection of C and R. And, then the output we are observing across the resistance. And the how do we find the frequency response?
Detailed Explanation
In this chunk, we introduce C-R circuits, where a capacitor (C) and a resistor (R) are connected in series. The input signal is applied across this series combination, and the output is measured across the resistor. To analyze the behavior of the circuit regarding how it responds to different frequencies, we will derive the frequency response, which is a critical aspect in electronics for understanding circuit behavior under varying input conditions.
Examples & Analogies
Think of the C-R circuit as a water system where C is a water tank (capacitor) and R is a pipe (resistor). The input water flow (signal) goes into the tank first, and the pressure (output) is measured at the end of the pipe. The frequency response tells us how different water flow rates (frequencies) affect the water pressure at the end of the pipe.
Laplace Domain Analysis
Chapter 2 of 5
🔒 Unlock Audio Chapter
Sign up and enroll to access the full audio experience
Chapter Content
First we go to the Laplace domain then we analyze the circuit. Namely, let we draw the equivalent circuit in Laplace domain where the C part its impedance it is and for the resistor on the other hand it is directly it is same as R.
Detailed Explanation
In this step, we transition to the Laplace domain to evaluate the circuit. This involves converting the components into their impedance forms: the capacitor's impedance is represented using its Laplace equivalent, while the resistor remains unchanged. By doing this, we can analyze the circuit's response more systematically through algebraic equations rather than differential equations.
Examples & Analogies
Imagine changing the way we measure the water system. Instead of measuring water flow in real time (which could be complex), we take a snapshot (Laplace transformation) of how the system behaves under certain conditions. This allows us to understand its performance over time without dealing with constant changes.
Deriving the Transfer Function
Chapter 3 of 5
🔒 Unlock Audio Chapter
Sign up and enroll to access the full audio experience
Chapter Content
So, if we simply analyze this circuit what we are getting is that V (s) = R into the current flow which is V (s) divided by the series connection of R and the capacitor; so, R +.
Detailed Explanation
By analyzing the circuit using the Laplace transformed impedances, we derive a relationship for the output voltage (V(s)). This relationship results in the transfer function, which is a mathematical representation linking the output voltage to the input voltage in terms of their impedances. The transfer function plays a crucial role in determining how the circuit behaves at different frequencies.
Examples & Analogies
Think of this transfer function as a recipe that tells you how much water (output) you get for a given amount of incoming water (input), affected by the size of the tank (C) and the width of the pipe (R). This recipe allows us to predict how changing one ingredient affects the final outcome.
Transforming to Frequency Domain
Chapter 4 of 5
🔒 Unlock Audio Chapter
Sign up and enroll to access the full audio experience
Chapter Content
Now, this in the Laplace domain of course, the s is basically I should say it is having two part; two parts one is the real part and then the imaginary part.
Detailed Explanation
In this section, we discuss the transformation from the Laplace domain to the frequency domain. Each 's' in the transfer function has real and imaginary parts, which correspond to different behaviors of the circuit under various stimuli. By substituting 's' with 'jω', we transform our analysis to understand how the frequency response manifests in terms of magnitude and phase.
Examples & Analogies
Transforming the equations is like switching from a general car manual to a specific driving guide for a race track. Instead of general instructions, you're now getting detailed feedback on how the car performs at different speeds (frequencies) and turns (phase shifts).
Understanding Frequency Response
Chapter 5 of 5
🔒 Unlock Audio Chapter
Sign up and enroll to access the full audio experience
Chapter Content
So, if we simply make a plot of this function with ω, then we can get how the individual signal it is getting transformed before it is arriving to the output.
Detailed Explanation
Here, we plot the transfer function against frequency (ω) to visualize the frequency response. This plot indicates how the output signal magnitude and phase change as the frequency of the input signal varies. It's essential for understanding the circuit's filtering characteristics, whether it acts to pass or block certain frequencies.
Examples & Analogies
Imagine you're looking at a graph of traffic flow on a busy road at different times of the day. By analyzing this graph, you can predict rush hours (signal frequencies) and how they impact travel times (output signals). Just like traffic, electronic signals can behave differently based on frequency.
Key Concepts
-
Transfer Function: A mathematical representation of relationships between output and input in both time and frequency domains.
-
Poles and Zeros: Locations in the transfer function that determine the stability and frequency response behavior.
-
Cut-off Frequency: The frequency point marking the change in gain, typically recognized when the gain is reduced to -3 dB.
-
Bode Plot: A standardized graphical method for visualizing the frequency response of systems.
Examples & Applications
Analyzing an R-C circuit with a 10 kΩ resistor and a 1 µF capacitor to determine the cut-off frequency and bandwidth.
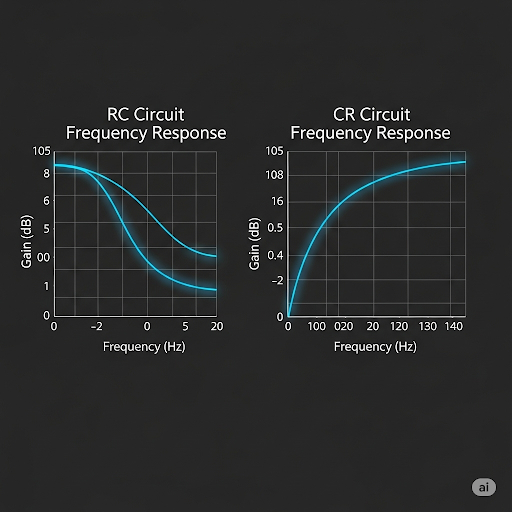
Comparing the frequency responses of an R-C circuit and a C-R circuit to illustrate how phase and gain behavior differs in practical applications.
Memory Aids
Interactive tools to help you remember key concepts
Rhymes
In R-C circuits, signals flow, high and low, at cut-off they'll show, gain will vary, as you know!
Stories
Once in the land of Electronic Waves, an R-C circuit met a C-R and discussed how they both filter sound, one keeping highs and the other holding lows, together they balanced the acoustic flows.
Memory Tools
Use the mnemonic 'GAINS' for Gain Analysis in the Input's Frequency with Notable Stability.
Acronyms
The acronym 'POLAR' helps remember that Poles Indicate where Output Losses Are located.
Flash Cards
Glossary
- RC Circuit
A circuit consisting of a resistor and a capacitor in a series or parallel configuration.
- CR Circuit
A circuit consisting of a capacitor followed by a resistor.
- Transfer Function
An expression that relates the output of a system to its input in the Laplace domain.
- Laplace Transform
A mathematical technique that transforms a time-domain function into a complex frequency domain.
- Bode Plot
A graphical representation of a system's frequency response, showing gain and phase against logarithmic frequency.
- Pole
A value of s that makes the denominator of the transfer function zero, influencing system stability and response.
- Zero
A value of s that makes the numerator of the transfer function zero, indicating points where the output is zero.
- Cutoff Frequency
The frequency at which the output power drops to half its maximum value, often characterized by a -3 dB point.
Reference links
Supplementary resources to enhance your learning experience.