
Magnitude and Phase Characteristics
Enroll to start learning
You’ve not yet enrolled in this course. Please enroll for free to listen to audio lessons, classroom podcasts and take practice test.
Interactive Audio Lesson
Listen to a student-teacher conversation explaining the topic in a relatable way.
Introduction to Frequency Response
🔒 Unlock Audio Lesson
Sign up and enroll to listen to this audio lesson

Today, we will explore the frequency response of amplifiers. Can anyone tell me what we understand by frequency response?

Isn't it how the output signal changes with different input frequencies?
Exactly! The frequency response shows how the gain of a circuit varies as we change the frequency of the input signal. Remember the acronym 'GRA' - Gain Response with frequency ADjustment.

What happens to the gain at low frequencies?
At low frequencies, the gain may be very low. The input signal might not propagate well. We model this behavior using components like capacitors and resistors.
Exploring R-C and C-R Circuits
🔒 Unlock Audio Lesson
Sign up and enroll to listen to this audio lesson

Let's explore R-C circuits. Who can describe the role of resistance and capacitance in this context?

I think the resistor helps control the current, while the capacitor can store charge.
Correct! This interplay greatly affects how these circuits respond to different frequencies. We can analyze their behavior in the Laplace domain.

How do we interpret the transfer function from the Laplace domain?
Great question! The transfer function helps us predict output behavior. Remember: `H(s) = (sCR) / (1 + sCR)` is our key equation.
Magnitude and Phase Response
🔒 Unlock Audio Lesson
Sign up and enroll to listen to this audio lesson
Now let's discuss how we determine magnitude and phase response at different frequencies.
Is it true that at very high frequencies, the phase reaches 0 degrees?
Exactly! At such frequencies, the capacitor acts almost like a short circuit, leading to a phase shift of 0 degrees. Let’s recap that with the mnemonic 'CAPTURE' - Capacitors Act as Short Under Tight Range of Frequencies.
And at lower frequencies, we see maximum phase shift of 90 degrees, right?
Correct! Knowing these shifts is crucial in designing circuits.
Bode Plots and Frequency Characteristics
🔒 Unlock Audio Lesson
Sign up and enroll to listen to this audio lesson
Let's move on to Bode plots. Who can explain the benefit of using logarithmic scales for frequency?
It allows us to represent a wide range of frequencies in a single graph!
Absolutely! This is incredibly useful when analyzing amplifiers. Keep in mind 'PLOG' – Plot Logarithmically for Optimal Gain.
And the cut-off frequency is important as well?
Yes! The cut-off frequency delineates the pass band from the stop band.
Recap and Application
🔒 Unlock Audio Lesson
Sign up and enroll to listen to this audio lesson
Let's summarize the key aspects of frequency response we've discussed today. Can anyone list them?
We talked about how gain varies with frequency, R-C circuits, and Bode plots!
Great recap! Use the acronym 'FRAG' – Frequency Response Analysis Guide to remember key topics!
This will definitely help in understanding real-life amplifier applications.
Introduction & Overview
Read summaries of the section's main ideas at different levels of detail.
Quick Overview
Standard
The section explores the frequency response characteristics of common emitter (CE) and common source (CS) amplifiers while revisiting the R-C and C-R circuits. It emphasizes how gain varies with input signal frequency, the significance of the transfer function, and introduces the Bode plot for visualizing frequency response.
Detailed
Magnitude and Phase Characteristics
This section delves into the frequency response characteristics of common emitter (CE) and common source (CS) amplifiers, focusing on how the gain of these amplifiers varies with frequency changes in the input signal. The discussion begins by revisiting basic R-C and C-R circuits to establish a foundation for understanding frequency response.
Key Points:
- Frequency Response: The section begins by outlining how the gain of CE and CS amplifiers can change with frequency, setting the stage for understanding their performance under different conditions.
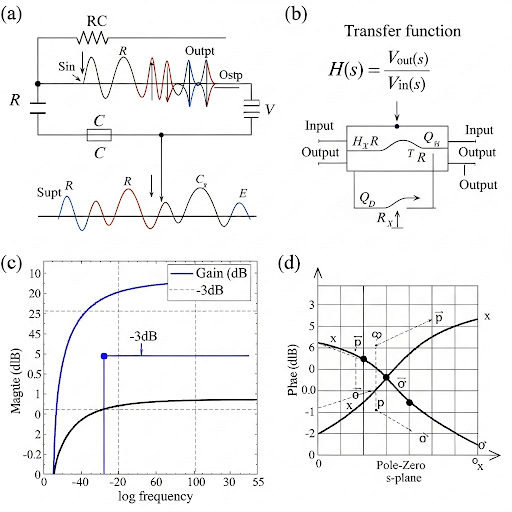
- Transfer Function: By analyzing R-C circuits in the Laplace domain, the gain can be expressed as a transfer function. Understanding the transition from the Laplace domain to the frequency domain shows how gain and phase shift are affected by frequency changes.
- Magnitude and Phase Characteristics: The discussion highlights that the frequency response of a circuit is captured by plotting gain magnitude against frequency, illustrating how the output behavior alters with the input stimulus.
- Bode Plots: The section introduces Bode plots, which display gain (in dB) versus frequency on a logarithmic scale. This method simplifies the visualization of circuit performance over wide frequency ranges and emphasizes the importance of the corner frequency or cutoff frequency.
- Pole-Zero Relationship: The relation between poles of the transfer function and cutoff frequencies is elaborated upon, thereby highlighting the underlying mechanics that govern circuit behavior.
This understanding of frequency response is crucial for designing effective amplifier circuits that meet specific performance criteria under varying operating conditions.
Youtube Videos

Audio Book
Dive deep into the subject with an immersive audiobook experience.
Introduction to Frequency Response
Chapter 1 of 4
🔒 Unlock Audio Chapter
Sign up and enroll to access the full audio experience
Chapter Content
The frequency response of a circuit refers to how the behavior of the circuit changes with the frequency of the input stimulus. This can be seen through the system's output to input ratio, often expressed in terms of gain or transfer function.
Detailed Explanation
Frequency response helps us understand how the output of a circuit reacts when different frequencies are applied to the input. Essentially, the way signals are processed in an electronic circuit can vary significantly across different frequencies. Understanding this concept allows engineers to design circuits that perform optimally at specific frequency ranges.
Examples & Analogies
Consider a music speaker. When you play a bass song, the speaker's response is different compared to when you play a high-pitched sound. This is similar to how electronic circuits respond to various frequencies. Just like your ears might pick up more bass at lower frequencies, certain circuits might 'favor' or amplify certain frequency ranges.
Magnitude Response and Its Significance
Chapter 2 of 4
🔒 Unlock Audio Chapter
Sign up and enroll to access the full audio experience
Chapter Content
The magnitude response indicates how the output signal's amplitude changes in reaction to different frequencies of the input signal. The magnitude is expressed as a ratio, which is often plotted against frequency to understand how the circuit behaves overall.
Detailed Explanation
Magnitude response illustrates how much the output signal amplitude changes compared to the input signal's amplitude at various frequencies. This response is crucial to predict how well a circuit handles specific signals. Engineers analyze this magnitude response by plotting it, which reveals which frequencies the circuit amplifies or attenuates.
Examples & Analogies
Imagine tuning a guitar. Some strings (frequencies) resonate better than others allowing for clearer sound amplification. In electronics, similar tuning occurs where certain frequencies are amplified while others might be reduced, similar to how specific notes can sound clearer than others on your guitar.
Phase Response in Electronic Circuits
Chapter 3 of 4
🔒 Unlock Audio Chapter
Sign up and enroll to access the full audio experience
Chapter Content
Phase response describes the shift in the phase of the output signal relative to the input signal as the frequency changes. It is crucial because different phase shifts can affect how signals combine when multiple signals interact in a circuit.
Detailed Explanation
Phase response shows how much the timing of the output signal is delayed or advanced compared to the input signal as frequency varies. This phase shift can be very important in scenarios where signals need to synchronize, such as in communication systems. If signals are out of phase, it could result in interference, undermining their effectiveness.
Examples & Analogies
Think about synchronized swimming. Each swimmer needs to perform their moves at just the right moment relative to each other. If one swimmer is a moment off, the whole performance can look chaotic. In electronic circuits, similar synchronization happens, and managing phase shifts ensures signals work together correctly, like a well-performed routine.
Bode Plots: A Practical Tool
Chapter 4 of 4
🔒 Unlock Audio Chapter
Sign up and enroll to access the full audio experience
Chapter Content
Bode plots are used to graphically represent both the magnitude and phase response of a circuit as a function of frequency. They provide a clear visual means to assess how well a circuit will perform over a range of frequencies.
Detailed Explanation
Bode plots are powerful because they condense complex frequency response data into manageable visual representations. By plotting magnitude in decibels versus frequency in logarithmic scale, engineers can quickly evaluate how a circuit behaves, making it easier to design and troubleshoot. This method provides insights into performance that numerical data alone might obscure.
Examples & Analogies
Think of a Bode plot as a recipe book for a chef. Just as a recipe outlines how to combine ingredients for the best dish, a Bode plot shows how to combine various circuit behaviors for optimal performance across different frequencies. It allows engineers to see the 'flavor' of the circuit's performance clearly.
Key Concepts
-
Frequency Response: Describes how amplifiers behave when input frequencies vary.
-
Transfer Function: Key to analyzing circuit behavior in the Laplace domain.
-
Bode Plot: Visual representation of frequency response using logarithmic scales.
-
Cut-off Frequency: Critical point where output starts to decline significantly.
-
Pole-Zero Relationship: Understanding poles and zeros aids in predicting circuit performance.
Examples & Applications
In a common emitter amplifier, changing the input signal's frequency affects the gain, demonstrating the frequency response behavior of the amplifier.
The use of Bode plots helps visualize how an amplifier circuit will perform across different frequencies, aiding in circuit design.
Memory Aids
Interactive tools to help you remember key concepts
Rhymes
In circuits where the frequency will sway, the gain will change in a major way.
Stories
Imagine a river (signal) flowing; at high flows (high frequencies) it rushes right through, while at low flows (low frequencies) it barely trickles.
Memory Tools
Remember CRAMP for circuits: Cut-off, Resistance and Amplifier Magnitude Phase.
Acronyms
FAR
Frequency Analysis Result - the takeaways from understanding frequency response.
Flash Cards
Glossary
- Frequency Response
The behavior of a circuit described by how its output varies with changes in frequency of the input signal.
- Transfer Function
A mathematical representation of the relationship between the input and output of a system in the Laplace domain.
- Bode Plot
A graphical method for displaying the frequency response of a system, utilizing logarithmic scales.
- Cutoff Frequency
The frequency point at which the output signal is reduced to a specific fraction of the input signal, typically -3 dB in amplifier circuits.
- PoleZero Relationship
The correlation between the positions of poles and zeros in a transfer function and the cut-off frequencies of a circuit.
Reference links
Supplementary resources to enhance your learning experience.