
Laplace Domain Analysis
Enroll to start learning
You’ve not yet enrolled in this course. Please enroll for free to listen to audio lessons, classroom podcasts and take practice test.
Interactive Audio Lesson
Listen to a student-teacher conversation explaining the topic in a relatable way.
Introduction to Frequency Response
🔒 Unlock Audio Lesson
Sign up and enroll to listen to this audio lesson

Today, we will explore the frequency response of CE and CS amplifiers. Can anyone tell me what we mean by frequency response?

Is it how the amplifier behaves as we change the frequency of the input signal?
Exactly! The behavior can be quantified in terms of gain, which is critical for understanding how amplifiers work at different frequencies.

What changes in the circuit affect this gain?
Good question! Factors like coupling capacitors and resistor biasing affect the gain, especially around the cutoff frequency.
Let's remember: **G**ain changes with **F**requency due to **C**apacitors and **R**esistors, or simply GFC for short!

Can we apply this concept to both CE and CS amplifiers?
Indeed! While the underlying principles are similar, the configuration and behavior might slightly differ.
In summary, today we learned that frequency response indicates an amplifier's gain changes with frequency, influenced by components like capacitors and resistors.
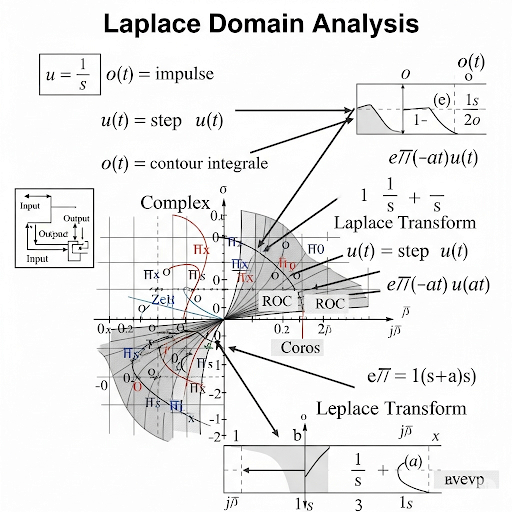
Understanding the Laplace Domain
🔒 Unlock Audio Lesson
Sign up and enroll to listen to this audio lesson

Now, let’s dive into the Laplace domain. Why do we use it in circuit analysis?

Isn’t it easier to analyze circuits with different components in the s-domain?
Exactly! The Laplace transform allows us to handle circuit equations more easily, especially when considering complex frequencies.
How do we represent resistors and capacitors in the Laplace domain?
Great question! A resistor R remains R, while a capacitor C with impedance is represented as 1/(sC).
Remember: **R** is **R** and **C** is **1/sC**! That's an easy way to recall.
What happens when we analyze a circuit using these definitions?
When we analyze, we derive transfer functions that show how input and output signals relate. This is crucial for understanding the system's response.
To summarize, the Laplace domain simplifies circuit analysis by transforming circuit components into a format that can be readily manipulated.
Transfer Functions and Frequency Response
🔒 Unlock Audio Lesson
Sign up and enroll to listen to this audio lesson
Let’s explore the relationship between transfer functions and frequency response. How are they connected?
Doesn’t the transfer function show how output varies with input?
Yes! And when we substitute s with jω, we get the frequency response from the transfer function.
What do we learn from this frequency response?
The frequency response shows the gain and phase shift as a function of input frequency, critical for designing amplifiers.
Here’s a memory aid: **G**ain and **P**hase can be derived from the **T**ransfer function, or GPT for short!
What does the pole-zero relationship tell us?
It’s significant! Poles in the transfer function relate to the cutoff frequencies seen in the frequency response. Understanding this relationship helps us design better circuits.
To summarize, connecting transfer functions to frequency responses lets us predict how amplifiers behave based on their design.
Bode Plots
🔒 Unlock Audio Lesson
Sign up and enroll to listen to this audio lesson
Let’s shift our focus to Bode plots. Why do we use them in analyzing frequency response?
Bode plots help visualize how gain and phase shift change over a range of frequencies, right?
Correct! They are essential for seeing trends across logarithmic scales, making them easier to analyze than linear formats.
What are the axes of a Bode plot?
The x-axis typically represents the frequency on a logarithmic scale, while the y-axis will denote gain in decibels or phase in degrees.
A helpful way to remember this is: **F**requency on the **L**og scale and **G**ain in **D**ecibels, or FLGD.
How does this plotting style help in real-world applications?
Bode plots allow engineers to design and adjust amplifiers for desired performance over wide frequency ranges, ensuring effective signal processing.
In conclusion, Bode plots are fundamental for visualizing and designing systems to ensure they meet performance specifications across frequencies.
Introduction & Overview
Read summaries of the section's main ideas at different levels of detail.
Quick Overview
Standard
In this section, the frequency response of Common Emitter and Common Source amplifiers is explored, emphasizing the analysis of circuits using R-C and C-R configurations. The relationship between transfer functions, frequency response, and pole-zero locations in the Laplace domain is also outlined, aiming to provide a foundational understanding for analyzing amplifier frequency response.
Detailed
Detailed Summary of Laplace Domain Analysis
This section delves into the frequency response of Common Emitter (CE) and Common Source (CS) amplifiers. Starting with an overview of circuits in the Laplace domain, the text explains the transformation from time domain to Laplace domain through impedance representation of passive elements like resistors and capacitors. The focus is primarily on how circuit gain varies with frequency due to different components, including coupling capacitors and bias circuits.
Key points highlighted include:
- The analysis begins with the R-C and C-R circuits, establishing a foundational understanding of their transfer functions.
- The magnitude and phase of the transfer function are discussed in-depth, elucidating how these elements dictate the amplifier's behavior based on the input's frequency.
- A significant relationship between the transfer function's poles and zeros and the amplifier's cutoff frequency is defined, illustrating what happens as frequencies move beyond certain thresholds.
- The difference between frequency response in linear versus logarithmic scales (Bode plots) is introduced, emphasizing their utility in visualizing circuit behavior across a wide range of frequencies.
- Finally, design guidelines for amplifiers based on frequency response are mentioned, setting the stage for practical applications beyond theoretical analysis.
Youtube Videos

Audio Book
Dive deep into the subject with an immersive audiobook experience.
Introduction to Laplace Domain Analysis
Chapter 1 of 6
🔒 Unlock Audio Chapter
Sign up and enroll to access the full audio experience
Chapter Content
Now, what do we have in this plan, in this module; it is the or rather today and the next classes are the following. So, we are planning to cover as I said that we are going to cover frequency response of common source and common emitter amplifier.
Detailed Explanation
In this introductory chunk, the speaker outlines the structure of the upcoming lessons on frequency response involving common source and common emitter amplifiers. This approach targets students' understanding of how these amplifiers behave in different frequency ranges, setting the stage for detailed exploration of frequency response in the Laplace domain.
Examples & Analogies
Think of analyzing a musical instrument's sound: just like different instruments create various sounds at different frequencies, amplifiers work similarly at different frequencies. We will be exploring how well these amplifiers perform across a range, much like tuning different instruments to find the best sound.
Revisiting R-C and C-R Circuits
Chapter 2 of 6
🔒 Unlock Audio Chapter
Sign up and enroll to access the full audio experience
Chapter Content
To understand that first what we will do that we will revisit the frequency response of R-C circuit and C-R circuit. And, then based on the R-C and C-R circuit we will be talking about the transfer function of a typical system R-C or C-R combination.
Detailed Explanation
Here, the speaker emphasizes the importance of revisiting R-C (Resistor-Capacitor) and C-R (Capacitor-Resistor) circuits to understand their frequency responses. This foundational knowledge is crucial as it informs students about the transfer function, which describes how input signals are converted into output signals. Recognizing these relationships in basic circuits will facilitate a better grasp of more complex amplifier functions.
Examples & Analogies
Think of an R-C circuit like a team of runners: the resistor is slow and steady, while the capacitor can sprint quickly. In a race (input signal), the balance between these two can significantly change your chances of winning (the output signal) depending on their strengths, just like frequency responses can change outcomes.
Transfer Function Analysis
Chapter 3 of 6
🔒 Unlock Audio Chapter
Sign up and enroll to access the full audio experience
Chapter Content
So, if we simply analyze this circuit what we are getting is that V (s) = R into the current flow which is V (s) divided by the series connection of R and the capacitor; so, R + ...
Detailed Explanation
The chunk illustrates the mathematical procedure for analyzing an R-C circuit within the Laplace domain. Essentially, the equation identifies how the input voltage (V(s)) relates to the output voltage across the resistor using the circuit’s total impedance (R + 1/sC). This analysis allows the student to see how signals change as they pass from input to output, offering invaluable insight into circuit behavior.
Examples & Analogies
Imagine a water management system where resistors act as pipes restricting flow and capacitors serving as water tanks buffering sudden changes. When measuring how water (voltage) flows through the system, just as we consider how pressures change, we need to factor in how tank sizes and pipe widths affect the flow rates.
From Laplace Domain to Frequency Domain
Chapter 4 of 6
🔒 Unlock Audio Chapter
Sign up and enroll to access the full audio experience
Chapter Content
So, we can say that in the transfer function in Laplace domain whatever the s we do have, if we simply replace this s by jω, then whatever the transfer function we will we will get that that basically gives the frequency response of the circuit.
Detailed Explanation
This step explains how to transition from the Laplace domain to the frequency domain by substituting 's' with 'jω' (where j is the imaginary unit and ω is the angular frequency). This transition is critical because it allows students to derive the circuit’s frequency response, showcasing how output varies as a function of frequency, which is essential for understanding real-world circuit operations.
Examples & Analogies
Transforming from the Laplace to frequency domain can be likened to tuning a radio. When you adjust the dial (replace 's' with 'jω'), you shift to different stations (input frequencies) to best capture your desired sound. Each adjustment can represent significant changes in what you hear – similar to how circuits react differently at various frequencies!
Magnitude and Phase Response
Chapter 5 of 6
🔒 Unlock Audio Chapter
Sign up and enroll to access the full audio experience
Chapter Content
Now, if we say that this is input to output transfer function in frequency domain or Fourier domain, then if we take the magnitude of it; so, it is basically it is a complex number...
Detailed Explanation
This chunk delves into the concept of magnitude and phase response in the frequency domain. It explains that the transfer function results in a complex number representing both the magnitude (essentially the output signal level) and the phase (the time offset of the output signal). Understanding these helps in analyzing how circuit settings impact their performance under varied signal conditions.
Examples & Analogies
Consider a concert where the musicians (output signals) need to be in sync with each other but also control their volume. The magnitude response would be how loud each musician plays, while the phase response is when they enter the song. Balancing volume and timing is akin to optimizing a circuit for both magnitude and phase for the desired sound.
Graphical Representation: Bode Plot
Chapter 6 of 6
🔒 Unlock Audio Chapter
Sign up and enroll to access the full audio experience
Chapter Content
Typically, instead of considering these two plots the commonly used plot it is something called bode plot, where this ω the frequency it is in log scale...
Detailed Explanation
In this final chunk, the speaker introduces the concept of Bode plots, a graphical representation of magnitude and phase response using logarithmic frequency scales. Bode plots allow for easier visualization of the circuit’s response across a wide frequency range and help in understanding how the gain transforms at various frequencies.
Examples & Analogies
Think of a Bode plot like a street map of a city showing different routes (gain) across various distances (frequencies). Just as some streets become busy at rush hour while others remain clear, Bode plots illustrate how a circuit's performance changes across different frequency settings, guiding engineers in optimal design choices.
Key Concepts
-
Frequency Response: The variation of gain and phase with respect to input frequency in amplifiers.
-
Laplace Domain: A mathematical representation of circuits that simplifies analysis by using complex frequency.
-
Transfer Function: A mathematical function that quantifies the relationship between the input and output of a system in the Laplace domain.
-
Bode Plot: A graphical method for representing gain and phase shift of a system over a range of frequencies.
Examples & Applications
Example of a high-pass filter using an RC circuit, illustrating how low frequencies are attenuated while high frequencies pass.
Example showing the Bode plot for a typical amplifier, demonstrating gain versus frequency response.
Memory Aids
Interactive tools to help you remember key concepts
Rhymes
A gain that's high, a phase that shifts, through frequencies wide, the signal lifts!
Acronyms
GFC
Gain changes with Frequency due to Components.
Stories
In a land of signals, a wise old amplifier learned to dance with frequency, altering its gain effortlessly as the music shifted, making it beloved among the circuits.
Memory Tools
FLGD: Frequency on Logarithmic scale, Gain in Decibels.
Flash Cards
Glossary
- Laplace Transform
A mathematical transformation used to convert differential equations into algebraic equations.
- Transfer Function
A function that describes the output-to-input ratio of a system in the Laplace domain.
- Frequency Response
The steady-state response of a system to sinusoidal inputs at varying frequencies.
- Rolloff
The rate at which gain decreases beyond the cutoff frequency in frequency response.
- Bode Plot
A graphical representation of the transfer function magnitude and phase versus frequency on a log scale.
- PoleZero Plot
A graphical representation showing the locations of poles and zeros of a transfer function in the complex plane.
Reference links
Supplementary resources to enhance your learning experience.