
Transformation of Transfer Function to Frequency Domain
Enroll to start learning
You’ve not yet enrolled in this course. Please enroll for free to listen to audio lessons, classroom podcasts and take practice test.
Interactive Audio Lesson
Listen to a student-teacher conversation explaining the topic in a relatable way.
Fundamentals of Frequency Response
🔒 Unlock Audio Lesson
Sign up and enroll to listen to this audio lesson

Today we'll start discussing frequency response. Can anyone tell me what we mean by 'frequency response' in the context of circuits?

Isn't it how the output of a circuit changes with different input frequencies?
Exactly! It's about observing how the output behaves as we vary the input frequency. Let's consider RC circuits first. Can anyone describe how an RC circuit responds to low and high frequencies?

At low frequencies, the output decreases, and at high frequencies, it levels out?
Correct! This behavior is essential when we analyze more complex circuits like amplifiers. Remember, as we transform our transfer functions, we need to look at both the magnitude and phase of our output.
Transfer Function to Frequency Domain
🔒 Unlock Audio Lesson
Sign up and enroll to listen to this audio lesson

Now, let's talk about transitioning from the Laplace domain to the frequency domain. When we say 's' in the Laplace domain, what can we replace it with in the frequency domain?

I think we replace 's' with 'jω', right?
Great job! This transformation is key to finding our frequency response. The equations then tell us how gain and phase vary with frequency.

What happens at the cut-off frequency?
Excellent question! At the cut-off frequency, the output power drops to half of its maximum value. This is where our transfer function starts to show different upper and lower limits.
Understanding Magnitude and Phase Shift
🔒 Unlock Audio Lesson
Sign up and enroll to listen to this audio lesson
Let’s dive deeper into magnitude and phase shifts. How do you think changes in frequency affect the phase of an output signal?
I think the phase shift gets smaller as frequency increases, right?
That's right! Initially, at low frequencies, we may see up to 90° phase shifts, but as we reach higher frequencies, this might tend toward 0°.
So it essentially aligns with the input signal at high frequencies?
Exactly! The alignment shows how the circuit behaves like a pass circuit at high frequencies.
Bode Plots and Their Importance
🔒 Unlock Audio Lesson
Sign up and enroll to listen to this audio lesson
Bode plots are another critical tool for visualizing frequency response. Who can explain why log scale is preferred for frequency in Bode plots?
It's easier to represent a wide range of frequencies without compressing the information, right?
Exactly! By using log scale, we can clearly observe the circuit's behavior over vast ranges. Remember the significance of the corner frequency in this context.
At what point do we consider a frequency as our cut-off frequency?
The cut-off frequency is where our gain drops by 3 dB from its maximum value. It marks the boundary of the pass band. Keep this in mind when analyzing real-world circuits!
Introduction & Overview
Read summaries of the section's main ideas at different levels of detail.
Quick Overview
Standard
In this section, we explore how to convert transfer functions from the Laplace domain to the frequency domain. We examine the implications of frequency changes on the gain of common emitter (CE) and common source (CS) amplifiers, emphasizing the role of poles and zeros in shaping the circuit’s frequency response.
Detailed
Transformation of Transfer Function to Frequency Domain
In this section, we focus on the crucial concept of transforming transfer functions from the Laplace domain to the frequency domain, specifically as it applies to analog electronic circuits. The emphasis is placed on the frequency response of common emitter (CE) and common source (CS) amplifiers, as well as understanding how input signal frequency affects circuit gain.
Key Points Covered:
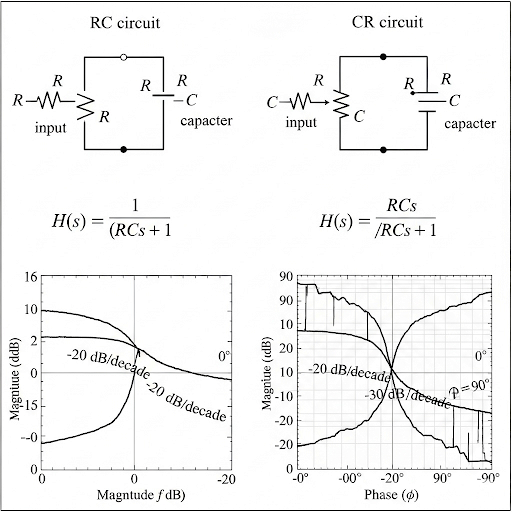
- Understanding Frequency Response: We revisit the frequency response of RC and CR circuits to lay the groundwork for discussing CE and CS amplifiers.
- Transfer Function in Laplace Domain: The transfer function in the Laplace domain is a mathematical representation of the circuit dynamics, expressed as
$$ V(s) = \frac{R \cdot I(s)}{R + \frac{1}{sC}} $$ which simplifies to a certain form used to analyze frequency response. - Transformation to Frequency Domain: By substituting s with jω (where j is the imaginary unit and ω is the frequency), we derive the corresponding frequency response.
- Magnitude and Phase Analysis: The analysis delves into how the gain (magnitude) and phase shift of the output signal vary with frequency, and defines critical points like cut-off frequencies, where the response shifts from pass to stop bands.
- Bode Plots: The section concludes with a discussion on Bode plots as a powerful tool for analyzing and visualizing the frequency response of circuits, explaining why logarithmic scale is used for frequency and gain representation.
This section encapsulates the foundational principles needed for understanding how circuits behave with varying frequencies, which is vital for designing and analyzing amplifiers in electronic circuits.
Youtube Videos

Audio Book
Dive deep into the subject with an immersive audiobook experience.
Introduction to Transformation
Chapter 1 of 5
🔒 Unlock Audio Chapter
Sign up and enroll to access the full audio experience
Chapter Content
To start with, let us revisit the frequency response of R-C circuit and C-R circuit. And, then based on the R-C and C-R circuit we will be talking about the transfer function of a typical system R-C or C-R combination.
Detailed Explanation
In this chunk, we talk about understanding the concepts of frequency response using an R-C and C-R circuit. These circuits act as basic examples to explain how we derive transfer functions, which describe the input-output relationship of a system. A transfer function helps us understand how the circuit behaves with varying input signals, particularly at different frequencies.
Examples & Analogies
Think of an R-C circuit like a doorbell chime that gets louder as you press the button but only within a certain time. If you press too hard or too long (high frequency), the chime sounds the same, but if you press too short (low frequency), the chime may not ring at all. Hence, understanding how the circuit reacts to varied pressing times helps us gauge its performance.
Laplace Domain Analysis
Chapter 2 of 5
🔒 Unlock Audio Chapter
Sign up and enroll to access the full audio experience
Chapter Content
In the Laplace domain, the impedance of the capacitor is represented by a complex term. When analyzing the R-C circuit in Laplace domain, the relationship between the input and output can be expressed as V(s) = R * (I(s)) / (R + 1/sC). After simplifying, we get V(s) = (sCR) / (1 + sCR).
Detailed Explanation
In this analysis, we move to the Laplace domain to derive the circuit's transfer function. The equation V(s) = (sCR)/(1 + sCR) results from understanding how the current through the components interacts with input voltage. Here, the transfer function helps describe the dynamics of the circuit in response to varying input frequencies, encapsulating both resistive and capacitive effects.
Examples & Analogies
Imagine you are trying to fill a swimming pool with water (input voltage) through a hose where the flow rate can change based on how you adjust the nozzle (the resistive part) and the hose's length (the capacitive part). The transfer function helps us measure how fast or slow the pool fills up as you change the hose settings and water flow.
Frequency Domain Transformation
Chapter 3 of 5
🔒 Unlock Audio Chapter
Sign up and enroll to access the full audio experience
Chapter Content
To obtain the frequency response, we make the transformation from the Laplace domain to the frequency domain by substituting s with jω. This leads us to the frequency response F(jω), which describes how the circuit behaves in response to sinusoidal inputs at different frequencies.
Detailed Explanation
The transformation from the Laplace domain to the frequency domain involves replacing 's' (which represents complex frequency) with 'jω'. This substitution allows us to evaluate the behavior of the circuit specifically for sinusoidal signals, which are fundamental in analyzing frequency response. Once transformed, we can analyze how the gain and phase of the output signal changes with frequency.
Examples & Analogies
Picture tuning a radio to pick up different frequencies. Each frequency corresponds to a station (our input signal), and depending on how you set the dial (substituting 's' with 'jω'), you either hear a clear sound or static noise. Just like tuning the radio gives you the best sound at specific spots, substituting in our equations gives us insight into how the circuit reacts to various frequencies.
Magnitude and Phase Analysis
Chapter 4 of 5
🔒 Unlock Audio Chapter
Sign up and enroll to access the full audio experience
Chapter Content
Once we have the frequency response, we can examine its magnitude and phase. The magnitude tells us how much the output signal is amplified or attenuated, while the phase indicates how much the output signal lags or leads the input signal.
Detailed Explanation
Understanding magnitude and phase helps us comprehend how the output of our circuit interacts with the input signal over different frequencies. The magnitude indicates the level of signal amplification or attenuation, while the phase reveals time shifts in the output signal relative to input. This information is essential for designing and optimizing circuits for specific applications.
Examples & Analogies
Think of an echo in a canyon. The magnitude could be how loud the echo sounds when you yell (strength of the output), while the phase is how soon you hear it after the original sound. Depending on where you are, the echo might come back immediately (phase close to 0) or after a noticeable delay (phase shifted). This demonstrates how the circuit's response can vary across different frequencies.
Bode Plot Representation
Chapter 5 of 5
🔒 Unlock Audio Chapter
Sign up and enroll to access the full audio experience
Chapter Content
In practice, the frequency response is often represented using Bode plots, where the magnitude is expressed in decibels (dB) and frequency on a logarithmic scale. This representation helps visualize the circuit's performance across a broad frequency range.
Detailed Explanation
Bode plots break down complex frequency data into two separate graphs—one for magnitude in decibels and another for phase—allowing us to see how a circuit reacts over different frequencies. Using a logarithmic scale for frequency helps to condense a wide range of frequencies into a more manageable view, making patterns easier to interpret.
Examples & Analogies
Think of measuring your height over the years. At first, your height change is dramatic, but as an adult, it stabilizes. If you plotted your growth annually versus height, it would be a normal graph. However, if you plotted your age in decades on a logarithmic scale, you could see growth patterns more clearly. The Bode plot works similarly, helping engineers analyze circuit behavior comprehensively.
Key Concepts
-
Laplace Domain: The complex frequency domain used for analyzing electrical circuits.
-
Frequency Response: Describes how the output of a circuit varies with the input frequency.
-
Gain: The ratio of output to input signal strength.
-
Phase Shift: The shift in time of the output signal compared to the input signal.
-
Bode Plot: A method for visualizing gain and phase shift over various frequencies.
Examples & Applications
An RC circuit behaves differently at 50 Hz than at 10 kHz. At low frequencies, it acts like a high pass filter, while at high frequencies, it allows signals to pass with little attenuation.
In designing filters, knowing the cut-off frequency helps engineers determine at which point the filter will start to significantly attenuate signals.
Memory Aids
Interactive tools to help you remember key concepts
Rhymes
In a circuit that frequencies change, the gain may rise or slightly rearrange.
Stories
Imagine a concert where musicians play at different frequencies; the responses of the audience represent how amplifiers react to these signals.
Memory Tools
For remembering frequencies: 'Low cuts, high passes – a filter's game in circuits explains.'
Acronyms
CPP - 'Capacitance and Polarity guide the Performance in frequency response.'
Flash Cards
Glossary
- Frequency Response
The output behavior of a circuit as the input frequency is varied.
- Transfer Function
A mathematical representation of the relationship between the input and output of a system in the Laplace domain.
- Cutoff Frequency
The frequency at which the output power of a circuit drops to half of its maximum value.
- Bode Plot
A graphical representation of a system’s frequency response, plotting gain and phase against frequency on a logarithmic scale.
- Pole
A frequency at which the transfer function becomes infinite, affecting the behavior of the circuit.
Reference links
Supplementary resources to enhance your learning experience.