
Frequency Response Analysis with Examples
Enroll to start learning
You’ve not yet enrolled in this course. Please enroll for free to listen to audio lessons, classroom podcasts and take practice test.
Interactive Audio Lesson
Listen to a student-teacher conversation explaining the topic in a relatable way.
Introduction to Frequency Response
🔒 Unlock Audio Lesson
Sign up and enroll to listen to this audio lesson

Welcome, students! Today, we're diving into the exciting world of frequency response. Can anyone tell me what frequency response means in the context of amplifiers?

Is it how the amplifier responds to different frequencies of input signals?
Exactly! The frequency response indicates how the gain of an amplifier changes when we input signals at various frequencies. This characteristic is crucial for understanding amplifier performance.

So, how do we analyze this in common emitter and common source amplifiers?
Great question! We use transfer functions derived from the R-C and C-R circuits to represent the input-output relationship. We'll explore that today!
Transfer Functions in Circuit Analysis
🔒 Unlock Audio Lesson
Sign up and enroll to listen to this audio lesson

Let’s remember, in an R-C circuit, the transfer function can be expressed as T(s) = V_out/V_in = sCR/(1+sCR). What does this imply?

It shows how the output voltage relates to the input, factoring in the frequency through s.
Exactly! And converting this to the frequency domain involves substituting 's' with 'jω'. Can anyone tell me what we achieve from this?

We get the frequency response, which captures how gain and phase shift change with frequency!
Correct! Thus, we can analyze the amplifier's performance as the frequency of the input signal varies.
Understanding Bode Plots
🔒 Unlock Audio Lesson
Sign up and enroll to listen to this audio lesson
Now let's visualize frequency response using Bode plots. Can someone remind me how these plots differ from regular plots?
Bode plots use a logarithmic scale for the frequency axis and decibels for gain...
Right! This allows us to represent a wide range of frequencies and gain values effectively. What do we usually find at the cutoff frequency in these plots?
The gain level where the amplifier starts to attenuate signals beyond that point.
Well done! And that specific point is often marked as the -3 dB point in the gain plot.
Practical Applications in Amplifiers
🔒 Unlock Audio Lesson
Sign up and enroll to listen to this audio lesson
To wrap up, why is understanding frequency response crucial for designing amplifiers?
It helps engineers tailor amplifiers for specific applications, ensuring they operate effectively at desired frequencies.
Exactly! Whether it's for audio applications or signal processing, knowing how an amplifier responds helps in better design and performance monitoring.
So, effective design guidelines are based on this analysis?
Yes! We'll dive deeper into these design guidelines in our next sessions, but today we've laid a strong foundation.
Introduction & Overview
Read summaries of the section's main ideas at different levels of detail.
Quick Overview
Standard
In this section, we explore the frequency response of CE and CS amplifiers by revisiting R-C and C-R circuits. We analyze the transfer function and its relation to frequency response, including the importance of poles and zeroes. The section highlights the practical implications of frequency response for amplifier design.
Detailed
Detailed Summary
This section provides an extensive overview of the frequency response of common emitter (CE) and common source (CS) amplifiers, key components in analog electronic circuits. It begins by revisiting fundamental concepts of R-C and C-R circuits as a foundation for understanding the frequency response. The focus then shifts to how these circuits react to varying frequencies, detailing the transfer function in both the Laplace domain and the frequency domain.
Key Concepts Covered:
- Transfer Functions: The section explains the derivation of the input-output transfer function using R-C and C-R circuit models, including the significance of the transfer function in analyzing circuit behavior across frequencies.
- Frequency Response: The response of the system to different stimuli frequencies is discussed, particularly how the gain (output/input ratio) changes, with graphical representation through plots showing both magnitude and phase responses.
- Bode Plots: The section introduces the concept of Bode plots, emphasizing their utility in visualizing gain and phase shifts over a logarithmic scale, effectively managing wide frequency ranges from 0 Hz to several MHz or GHz.
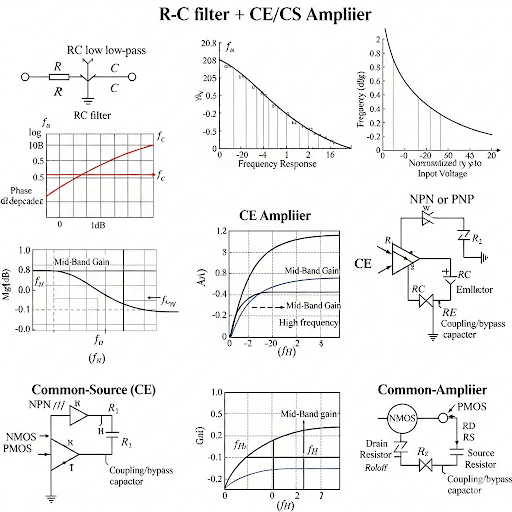
- High-Pass and Low-Pass Filters: By analyzing R-C circuits, the section demonstrates how they behave as high-pass filters beyond the cutoff frequency, a crucial design aspect for amplifiers used in various electronic applications.
- Real-Life Application: The significance of frequency response in practical design settings is highlighted, leading to considerations for design guidelines catered to both CE and CS amplifiers.
Youtube Videos

Audio Book
Dive deep into the subject with an immersive audiobook experience.
Introduction to Frequency Response
Chapter 1 of 6
🔒 Unlock Audio Chapter
Sign up and enroll to access the full audio experience
Chapter Content
Frequency response of common emitter and common source amplifier is affected by changing input signal frequency. We will see how to find the gain of these amplifiers with frequency considerations.
Detailed Explanation
Frequency response refers to how the output of a circuit responds to different frequencies of input signals. Common emitter (CE) and common source (CS) amplifiers exhibit changes in gain based on the frequency of input signals. While the previous module focused on gain calculations, this module illustrates the dependency of gain on frequency.
Examples & Analogies
Think about listening to music. The audio might sound great at certain volumes (frequencies), but as you increase the volume, the clarity (gain) might change based on how your speakers handle different sound frequencies.
Basic Circuit Analysis: RC and CR Circuits
Chapter 2 of 6
🔒 Unlock Audio Chapter
Sign up and enroll to access the full audio experience
Chapter Content
To understand frequency response, we will revisit RC and CR circuits. These circuits will help us derive the transfer function for various configurations and understand the relationship with frequency response.
Detailed Explanation
RC (resistor-capacitor) and CR (capacitor-resistor) circuits form the basis for analyzing frequency response. By considering their configurations, we can establish a transfer function that relates input and output signals. This function helps us assess how different frequency inputs affect the output.
Examples & Analogies
Imagine a water system where the pipes (resistors) and storage tanks (capacitors) respond to a water supply (input signal). Depending on how fast the water flows (frequency), the pressure at the output (output signal) will vary.
Deriving Transfer Functions
Chapter 3 of 6
🔒 Unlock Audio Chapter
Sign up and enroll to access the full audio experience
Chapter Content
By analyzing the RC and CR circuits in the Laplace domain, we derive the transfer function V(s) as R/(1+sCR). This helps us transition from the Laplace to frequency domain by replacing s with jω.
Detailed Explanation
In the Laplace domain, we represent the input-output relationship of circuits using a transfer function. For an RC circuit, it's expressed as V(s) = R/(1+sCR). By substituting s with jω (where j is the imaginary unit), we can transform this function to describe the circuit's behavior at varying frequencies in the frequency domain.
Examples & Analogies
Think of a sound system where varying sound waves (like musical notes) need to be optimized for clarity. Just like adjusting the settings on an equalizer changes outputs based on input frequencies, the transfer functions help us understand the circuit's adjustments at different frequencies.
Magnitude and Phase Response
Chapter 4 of 6
🔒 Unlock Audio Chapter
Sign up and enroll to access the full audio experience
Chapter Content
The transfer function can be expressed in terms of magnitude and phase. The magnitude indicates gain while the phase shows how input signals can lag or lead the output.
Detailed Explanation
The magnitude part of the transfer function reveals how the amplitude of the output signal changes with frequency, while the phase part indicates how much the output signal might be delayed in time compared to the input. Understanding both aspects is crucial for analyzing how effectively a circuit processes signals.
Examples & Analogies
Imagine two cars racing; one starting earlier than the other (phase) can determine the winner. If both cars perform equally well (magnitude), but one has a slower start, it might lose. Similarly, circuits can change how signals arrive despite having the same gain.
Understanding Bode Plots
Chapter 5 of 6
🔒 Unlock Audio Chapter
Sign up and enroll to access the full audio experience
Chapter Content
Bode plots are a graphical representation of frequency response. They show magnitude in decibels on a log scale alongside phase shift, providing insights into circuit behavior over a wide range of frequencies.
Detailed Explanation
Bode plots offer a clear and effective way to visualize how circuit gain and phase shift change with frequency. By plotting these on a logarithmic scale, we can analyze very low to very high frequencies without losing detail. This helps engineers design circuits to ensure optimal performance across frequencies.
Examples & Analogies
Consider a fitness tracker that shows your heart rate over time. A Bode plot is similar, tracking how your body's performance (gain) and recovery times (phase) change as you exercise at different intensities (frequencies).
High-Pass and Low-Pass Filter Behavior
Chapter 6 of 6
🔒 Unlock Audio Chapter
Sign up and enroll to access the full audio experience
Chapter Content
Analyzing the frequency response reveals that RC circuits behave like high-pass filters, while CR circuits mimic low-pass behavior, influencing how signals pass through.
Detailed Explanation
The frequency response of RC circuits allows high-frequency signals to pass while attenuating low-frequency signals, effectively making them high-pass filters. Conversely, CR circuits allow low frequencies to pass while blocking higher frequencies, acting as low-pass filters. Understanding these characteristics helps in designing circuits for specific applications.
Examples & Analogies
Think of a concert sound system: a high-pass filter could remove low bass sounds that muddy the music, making vocals clearer. A low-pass filter could keep only the deep bass, enhancing depth. Engineers use similar concepts to ensure signals are transmitted clearly.
Key Concepts
-
Transfer Functions: The section explains the derivation of the input-output transfer function using R-C and C-R circuit models, including the significance of the transfer function in analyzing circuit behavior across frequencies.
-
Frequency Response: The response of the system to different stimuli frequencies is discussed, particularly how the gain (output/input ratio) changes, with graphical representation through plots showing both magnitude and phase responses.
-
Bode Plots: The section introduces the concept of Bode plots, emphasizing their utility in visualizing gain and phase shifts over a logarithmic scale, effectively managing wide frequency ranges from 0 Hz to several MHz or GHz.
-
High-Pass and Low-Pass Filters: By analyzing R-C circuits, the section demonstrates how they behave as high-pass filters beyond the cutoff frequency, a crucial design aspect for amplifiers used in various electronic applications.
-
Real-Life Application: The significance of frequency response in practical design settings is highlighted, leading to considerations for design guidelines catered to both CE and CS amplifiers.
-
Examples & Applications
For a simple R-C circuit, the transfer function may show how the output voltage decreases as frequency increases.
A common emitter amplifier might have a frequency response indicating it acts as a high-pass filter above its cutoff frequency.
Memory Aids
Interactive tools to help you remember key concepts
Rhymes
To know the flow and how signals go, just check your gain against frequency show.
Stories
Imagine a party where signals come in waves. The higher the wave frequency, the more fun with sounds, until the low ones get drowned!
Memory Tools
For the cutoff frequency, remember: 'Cut the Low-3', where the signal fades.
Acronyms
C.A.G.E - Cutoff, Amplifier Gain, and Error; it’s the way frequency defines our behavior.
Flash Cards
Glossary
- Frequency Response
The variation of gain of an amplifier as a function of frequency of the input signal.
- Transfer Function
A mathematical representation of the relationship between the input and output of a system, expressed in the Laplace domain.
- Bode Plot
A graphical representation of the frequency response of a system, showing gain in decibels and phase in degrees on a logarithmic frequency scale.
- Cutoff Frequency
The frequency at which the output signal power drops to half its maximum value, often associated with the -3 dB point.
- HighPass Filter
A filter that allows signals with a frequency higher than a certain cutoff frequency to pass through while attenuating lower frequencies.
- LowPass Filter
A filter that allows signals with a frequency lower than a certain cutoff frequency to pass through while attenuating higher frequencies.
Reference links
Supplementary resources to enhance your learning experience.