
RC Circuit Analysis
Enroll to start learning
You’ve not yet enrolled in this course. Please enroll for free to listen to audio lessons, classroom podcasts and take practice test.
Interactive Audio Lesson
Listen to a student-teacher conversation explaining the topic in a relatable way.
Introduction to RC Circuits
🔒 Unlock Audio Lesson
Sign up and enroll to listen to this audio lesson

Today, we'll start with the basics of RC circuits. Who can tell me what an RC circuit consists of?

An RC circuit is made of a resistor and a capacitor.
Exactly! Now, when we apply an AC signal to the circuit, how do you think it affects the output?

I think it changes the voltage across the resistor.
Correct! The output across the resistor varies with frequency. Can anyone tell me why this happens?

Because the capacitor allows different frequencies to pass through differently?
Exactly! The capacitor reacts to frequency changes, which alters the current and voltage relations. Let's use the acronym CR to remember 'Capacitor-Resistor' interactions.
Now, to summarize, an RC circuit's output varies with the applied frequency due to the interactions of the capacitor and resistor.
Gain and Frequency Response
🔒 Unlock Audio Lesson
Sign up and enroll to listen to this audio lesson

Now that we know about RC circuits, let’s dive into how the gain changes with frequency. Who remembers what gain means?

Gain is the output voltage divided by the input voltage.
Right! Gain can vary based on frequency. What do we call the frequency at which the output begins to drop significantly?
Is it the cut-off frequency?
Correct! The cut-off frequency is vital as it indicates where the gain starts to fall off. Think of 'cut-off' as 'cutting off the gain'.
How is that cut-off frequency calculated?
Good question! For an RC circuit, it's given by ω_c = 1/(RC). Let's always calculate it using the product of the resistor and capacitor values.
In brief, the gain of RC circuits decreases at frequencies above the cut-off frequency, marking a significant transition in behavior.
Bode Plots and Phase Shift
🔒 Unlock Audio Lesson
Sign up and enroll to listen to this audio lesson
In our next session, we’ll learn about Bode plots. How do you think we can visually represent gain and phase changes?
Maybe on a graph with frequency on one axis?
Exactly! In Bode plots, we represent frequency on a logarithmic scale. What do you think this helps us to achieve?
It helps us see a wide range of frequencies clearly.
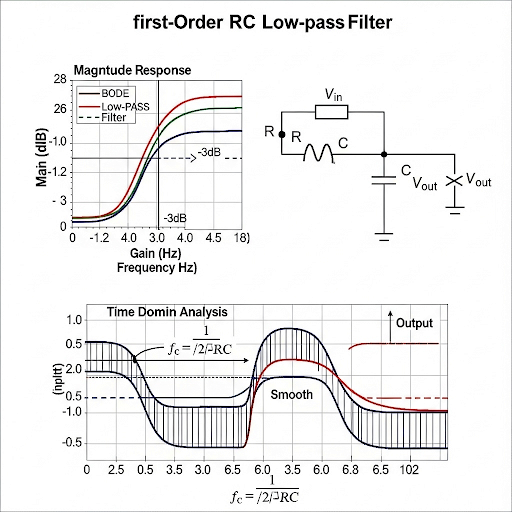
Correct! Plus, gain is represented in decibels (dB). Remember that a change of -3 dB corresponds to a point where we consider the cut-off frequency. Let’s summarize: Bode plots graphically showcase how an RC circuit responds to varying frequencies.
Relationship between Poles and Gain
🔒 Unlock Audio Lesson
Sign up and enroll to listen to this audio lesson
Finally, let’s talk about the relationship between the poles of transfer functions and our gain. What is a pole in this context?
It’s a point where the transfer function becomes infinite!
Exactly! Poles indicate how circuit behavior changes. Specifically, at the cut-off frequency, we have a pole. Can anyone explain why this is significant?
Because it affects how the circuit responds to signals of different frequencies!
Correct again! Understanding locations of poles helps us predict frequency response and stability. Remember: P for Pole is akin to 'Peak Response'.
To summarize: Poles indicate where significant behavior changes occur in amplifiers' frequency response. Recognizing this concept is key to effective circuit design.
Introduction & Overview
Read summaries of the section's main ideas at different levels of detail.
Quick Overview
Standard
The section elaborates on the frequency response characteristics of RC circuits, including the response of common emitter and common source amplifiers. It highlights how the gain changes with frequency and introduces the concepts of transfer functions, cut-off frequencies, and Bode plots.
Detailed
Detailed Summary
This section delves into the frequency response of common emitter (CE) and common source (CS) amplifiers, focusing on the foundational RC circuits that underlie their behavior. The analysis begins with a review of RC and CR circuits, explaining how changes in frequency affect gain. The gain of these amplifiers varies with frequency due to the coupling capacitor and biases implemented in the circuits.
The teacher emphasizes the importance of understanding transfer functions in the Laplace domain and how these transform into the frequency domain through substitution. This transformation reveals how the output-to-input ratios behave with varying stimulus frequencies, which is crucial for circuit designs.
To aid comprehension, the section introduces Bode plots which graphically represent gain in dB and phase shift against frequency in a logarithmic scale. These plots highlight the cut-off frequency, which indicates the threshold at which the output magnitude approaches 1. The significance of poles in the transfer function and their relation to frequency response is also discussed, underscoring their role in circuit behavior as either high-pass or low-pass filters.
Youtube Videos

Audio Book
Dive deep into the subject with an immersive audiobook experience.
Introduction to RC Circuits
Chapter 1 of 5
🔒 Unlock Audio Chapter
Sign up and enroll to access the full audio experience
Chapter Content
So, to start with let we go for the R-C and C-R circuit; I must say that this is more like recapitulation of whatever you know.
Detailed Explanation
In this chunk, we introduce R-C circuits, explaining that this is a review of concepts already familiar to students. An R-C circuit consists of a resistor (R) and a capacitor (C), connected either in series or parallel. This configuration is essential in electronic circuits as it affects how signals are processed, particularly in terms of frequency response.
Examples & Analogies
Think of an R-C circuit like a water tank system with a valve (the resistor) and a balloon (the capacitor). The valve controls the flow of water into the balloon, which can fill up and stretch but then slowly releases the water when the valve is closed. Depending on how fast the valve opens and closes (frequency of input), the behavior of the system changes.
Analyzing Circuit Response
Chapter 2 of 5
🔒 Unlock Audio Chapter
Sign up and enroll to access the full audio experience
Chapter Content
So, if we simply analyze this circuit what we are getting is that V(s) = R into the current flow which is V(s) divided by the series connection of R and the capacitor; so, R + 1/sC.
Detailed Explanation
In this chunk, we analyze how to determine the output voltage (V(s)) in the Laplace domain. The equation provided indicates that the output is proportional to the current through the circuit, divided by the total impedance of the series combination of the resistor and capacitor. This relationship is critical for understanding how signals modify as they pass through the R-C network.
Examples & Analogies
Imagine a traffic system where cars represent electric current. The resistor is a narrow road that limits how many cars can pass, while the capacitor is a parking lot where cars can temporarily wait. Depending on the road's width (resistance) and how far the parking lot stretches (capacitance), more cars can either pass through or get stored.
Transfer Function and Frequency Response
Chapter 3 of 5
🔒 Unlock Audio Chapter
Sign up and enroll to access the full audio experience
Chapter Content
Now, if we say that this is input to output transfer function in frequency domain or Fourier domain, then if we take the magnitude of it; so, it is basically it is a complex number.
Detailed Explanation
Here, the focus is on how the transfer function relates input and output in terms of frequency response. The transfer function is a mathematical representation that shows the output voltage as a function of input voltage and frequency. The magnitude of this function indicates how much output voltage occurs in response to a given input voltage at various frequencies.
Examples & Analogies
Picture a speaker emitting sound. The transfer function is similar to how that speaker responds to different frequencies of sound. For some frequencies, the sound might be very loud (high output), while for others, it might be barely audible (low output).
Magnitude and Phase Shift
Chapter 4 of 5
🔒 Unlock Audio Chapter
Sign up and enroll to access the full audio experience
Chapter Content
If we see that the magnitude part namely and then if you take mode of it and then if we plot with respect to ω.
Detailed Explanation
In this chunk, the concept of magnitude and phase shift of the output signal is discussed. When the output is plotted against frequency (ω), it reveals how the circuit's response changes. At different frequencies, the amplitude of the output signal may either increase or decrease, while the phase of the signal may shift. The magnitude shows how much the output signal grows or diminishes compared to the input.
Examples & Analogies
Consider a concert hall where the acoustics change how well different sounds are heard. Some instruments sound clearer at certain pitches, and that relates similarly to how the electrical signals change in strength and timing based on frequency.
Bode Plot and Its Importance
Chapter 5 of 5
🔒 Unlock Audio Chapter
Sign up and enroll to access the full audio experience
Chapter Content
This is where the gain it is going to be 0 and also along the frequency axis we like to cover wide range of frequency.
Detailed Explanation
A Bode plot is a graphical representation of the transfer function that shows both magnitude and phase response on logarithmic scales. The importance of this plot is that it allows engineers to visually assess how a circuit behaves over a wide range of frequencies. The Bode plot includes both gain (in decibels) and its corresponding phase shift as a function of frequency.
Examples & Analogies
Imagine trying to track a person's heart rate over time. A line graph could show the changes effectively, just like the Bode plot shows circuit performance. Each peak and valley indicates how certain frequencies are amplified or reduced, much like heartbeats that might fluctuate with activity.
Key Concepts
-
RC Circuit: Understanding its composition of resistors and capacitors.
-
Cut-off Frequency: The critical frequency marking the transition point in gain.
-
Bode Plot: A graphical representation of frequency response in a logarithmic scale.
-
Transfer Function: The mathematical foundation for analyzing circuit behavior.
-
Pole: A crucial factor in determining circuit response at specific frequencies.
Examples & Applications
Example of how the gain of an RC circuit varies with frequency using a simulation.
Calculating the cut-off frequency for a circuit with R = 10k ohms and C = 100nF.
Memory Aids
Interactive tools to help you remember key concepts
Rhymes
Cut-off frequency, watch it fall; as the gain declines, it's a circuit call!
Stories
Imagine a race between a capacitor and resistor. The capacitor speeds ahead at high frequencies, while the resistor holds back until the cut-off point.
Memory Tools
To remember the components: 'Resistor's Charge' for an RC circuit (R and C).
Acronyms
CR - Remember Capacitor first, then Resistor for analysis!
Flash Cards
Glossary
- RC Circuit
A circuit composed of resistors (R) and capacitors (C).
- Cutoff Frequency
The frequency at which the output of a circuit starts to significantly decrease.
- Gain
The ratio of output voltage to input voltage in a circuit.
- Bode Plot
A graphical representation of a system's frequency response, showing gain and phase shift.
- Transfer Function
A mathematical representation of the relationship between the input and output of a system in the Laplace domain.
- Pole
A frequency at which the transfer function becomes infinite, indicating significant behavior changes.
Reference links
Supplementary resources to enhance your learning experience.