
Frequency Response of Common Source and Common Emitter Amplifier
Enroll to start learning
You’ve not yet enrolled in this course. Please enroll for free to listen to audio lessons, classroom podcasts and take practice test.
Interactive Audio Lesson
Listen to a student-teacher conversation explaining the topic in a relatable way.
Introduction to Frequency Response
🔒 Unlock Audio Lesson
Sign up and enroll to listen to this audio lesson

Welcome back, students! Today, we are diving into the concept of frequency response in amplifiers, focusing particularly on common emitter and common source configurations. Can anyone explain what we mean by frequency response?

I think it's how the output of a circuit responds to different input frequencies.
Exactly! The frequency response indicates how gain varies as the input frequency changes. It's essential for understanding amplifier behavior. To remember, think of the acronym **GAV**: Gain And Variance.

How do we analyze that?
Great question! We often start by looking at simpler circuits like RC and CR circuits to derive their transfer functions, which helps us understand more complex systems like our amplifiers.

So, we can see how the circuit alters the input signal across different frequencies?
Precisely! Let's continue exploring how we connect these concepts further.
Transfer Functions and Frequency Analysis
🔒 Unlock Audio Lesson
Sign up and enroll to listen to this audio lesson

To make sense of amplifier frequency response, we use transfer functions. Can anyone tell me what a transfer function is?

Isn't it the ratio of output to input in the Laplace domain?
Exactly! For our circuits, we can find it by analyzing them in the Laplace domain, starting with the relationship V(s) = R * I(s) / (R + sC) for RC filters. If we replace 's' with 'jω', what do we get?
The frequency response function for that circuit!
Correct! The ratio tells us how the circuit behaves at various frequencies. Remember, at low frequencies, the output may drop but approaches 1 at high frequencies—this reflects high-pass filter behavior. Keep that analogy in mind!
How does that relate to Bode plots?
Excellent question! Bode plots graphically represent these changes, allowing easier analysis over a wide frequency range compared to linear plots.
Poles, Zeros, and Cutoff Frequency
🔒 Unlock Audio Lesson
Sign up and enroll to listen to this audio lesson
As we dig deeper, let's talk about poles and zeros. Why do they matter?
They impact the frequency response of the amplifier, right?
Exactly! Poles define where the gain begins to drop, while zeros indicate where it might rise again. The cutoff frequency is crucial—we'll see how it's connected to the transfer function when it reaches unity gain.
And the cutoff frequency is where the gain falls to -3 dB?
Yes! You all are getting this. Use the mnemonic **CUP**: Cutoff, Unity, Pole to help remember!
Got it! So the cutoff frequency is key in determining filter behavior.
Bode Plot Characteristics
🔒 Unlock Audio Lesson
Sign up and enroll to listen to this audio lesson
Now, let’s visualize our findings using Bode plots. Why are they helpful?
They can show both gain and phase in one graph, right?
Exactly! They let us analyze how gain changes across a spectrum of frequencies clearly. Remember, when gain drops below -3 dB, we enter the stop band.
What’s the importance of using logarithmic scales?
Great observation! Log scales allow us to compress wide frequency ranges visually, making analysis much easier. Use the acronym **LOGS**: Logarithmic Observation of Gain and Stability.
So it's all about clarity in representation.
Real-World Applications and Design Guidelines
🔒 Unlock Audio Lesson
Sign up and enroll to listen to this audio lesson
Lastly, let's talk about design guidelines for amplifiers. What factors should we keep in mind?
We should consider the desired frequency response based on the application!
Exactly! Depending on whether we're designing for audio or RF applications, our choice of components like capacitors and resistors varies greatly. Remember to think of it using the acronym **AID**: Application, Impedance, Design.
So unique needs impact our design choices significantly!
Correct! It's all about ensuring our amplifiers meet the desired operational criteria effectively.
Introduction & Overview
Read summaries of the section's main ideas at different levels of detail.
Quick Overview
Standard
The section introduces the frequency response of CE and CS amplifiers, explaining how changes in input frequency affect gain. It begins with a discussion on RC and CR circuits, transitioning to finding transfer functions and understanding poles, zeros, and cutoff frequency in both amplifiers. Emphasis is placed on the relationship between frequency response and circuit behavior.
Detailed
Detailed Summary
In this section, the focus is on the frequency response of common emitter and common source amplifiers, crucial components in analog electronic circuits. The interplay between input signal frequencies and circuit gain is explored thoroughly.
The first part revisits RC and CR circuits as foundational elements for understanding frequency response. Analyzing these circuits in the Laplace domain, we derive transfer functions that serve to describe system behavior concerning frequency changes. It is noted that by replacing 's' with 'jω' in the Laplace domain transfer function, we derive the frequency response of circuits, helping to visualize how gain and phase shift vary with frequency.
The discussion continues with the analysis of the gain, illustrating how it approaches unity (1) at high frequencies and diminishes at low frequencies, indicating a high-pass filter characteristic. The significance of the cutoff frequency, where the gain transitions from linear to flat response, is underscored, indicating the circuit's performance characteristics in different frequency ranges. The section also introduces Bode plots—a preferred representation method—to illustrate gain and phase response in a logarithmic scale. This allows for easier comprehension of circuit behavior across a broad frequency range.
Concluding the section, students are made aware of practical applications and design guidelines pertinent to these amplifiers, setting the stage for deeper analysis and numerical examples in subsequent classes.
Youtube Videos

Audio Book
Dive deep into the subject with an immersive audiobook experience.
Introduction to Frequency Response
Chapter 1 of 6
🔒 Unlock Audio Chapter
Sign up and enroll to access the full audio experience
Chapter Content
In today’s topic of discussion it is Frequency Response of CE and CS Amplifier; Common Emitter and Common Source Amplifier.
Detailed Explanation
The frequency response of a circuit describes how its output behaves in relation to an input signal as the frequency of that input signal changes. In this section, we are focusing on the frequency response of two specific types of amplifiers: the Common Emitter (CE) amplifier used in Bipolar Junction Transistor (BJT) circuits, and the Common Source (CS) amplifier used in MOSFET circuits.
Examples & Analogies
Think of frequency response like a musician adjusting their guitar to produce different tones. Just as a musician adjusts their instrument to match different musical frequencies, an amplifier adjusts its gain depending on the frequency of the input signal.
Influence of Frequency on Gain
Chapter 2 of 6
🔒 Unlock Audio Chapter
Sign up and enroll to access the full audio experience
Chapter Content
And, today what we will see that if we change the frequency of the input signal how the gain of the circuit whether it is common emitter or common source amplifier, it is it changes with frequency.
Detailed Explanation
As the frequency of the input signal changes, the gain of both the Common Emitter and Common Source amplifiers also changes. This is an important concept in analog circuits, as different frequencies may require different levels of amplification. Understanding how gain varies with frequency helps in selecting the right amplifier for specific applications.
Examples & Analogies
Imagine tuning a radio; as you change the station's frequency, you hear different levels of volume. Similarly, in amplifiers, as the input signal's frequency varies, the output gain changes.
Frequency Response Analysis
Chapter 3 of 6
🔒 Unlock Audio Chapter
Sign up and enroll to access the full audio experience
Chapter Content
To understand that first what we will do that we will revisit the frequency response of R-C circuit and C-R circuit.
Detailed Explanation
Before diving into the frequency response of amplifiers, we first analyze simpler circuits such as the R-C (Resistor-Capacitor) and C-R (Capacitor-Resistor) circuits. These circuits provide foundational knowledge about how components respond to varying frequencies, which is crucial for understanding the behavior of more complex circuits like the CE and CS amplifiers.
Examples & Analogies
Consider the way a water filter works; it lets certain frequencies (or sizes of particles) through while blocking others. Learning about simple R-C circuits helps us predict how amplifiers will handle different 'frequencies' of signals.
Transfer Function Relationships
Chapter 4 of 6
🔒 Unlock Audio Chapter
Sign up and enroll to access the full audio experience
Chapter Content
we will also discuss about what is the relationship between transfer function and then frequency response and then location of the pole zeroes in Bode in Laplace domain transfer function.
Detailed Explanation
A transfer function mathematically describes the relationship between the input and output of a system in the Laplace domain. The frequency response can be derived from this transfer function. Additionally, the poles and zeros—critical points in complex analysis—indicate the behavior and stability of the system, providing insights into how it will respond to different frequencies.
Examples & Analogies
Think of a transfer function like a recipe for a cake. Each ingredient (input) affects the final outcome (output), much like how different frequencies will impact the amplifier's performance.
Magnitude and Phase Response
Chapter 5 of 6
🔒 Unlock Audio Chapter
Sign up and enroll to access the full audio experience
Chapter Content
In other words the output will be obtaining that you can see that compared to 1 this is much lower...
Detailed Explanation
The magnitude and phase response describe how the output voltage of the system varies with frequency. The magnitude shows how much the signal is amplified, while the phase indicates the shift in timing between the input and output signals. These two aspects are crucial for understanding the complete behavior of the amplifier with respect to varying input frequencies.
Examples & Analogies
Imagine listening to a band play two songs where one starts off slow and then speeds up. The volume (magnitude) changes, and the timing of notes (phase) shifts, just like how we analyze current flowing through amplifiers at different frequencies.
Bode Plots and Graphing Frequency Response
Chapter 6 of 6
🔒 Unlock Audio Chapter
Sign up and enroll to access the full audio experience
Chapter Content
Typically, instead of considering these two plots the commonly used plot it is something called bode plot...
Detailed Explanation
Bode plots are a graphical representation of the frequency response of a system. They plot the gain (in decibels) and phase shift (in degrees) against frequency on a logarithmic scale. This allows for a clearer comparison across a wide range of frequencies and helps engineers design more efficient and reliable systems.
Examples & Analogies
Bode plots are like a roadmap showing the terrain of a mountain. They help you visualize how steep the climb (gain) or how gradual it is (phase) over a long distance (frequency range).
Key Concepts
-
Frequency Response: How amplifiers respond to different input frequencies.
-
Transfer Function: Key to understanding amplifier operations in the frequency domain.
-
Cutoff Frequency: Defines the operational limits of an amplifier.
-
Bode Plot: Tool for visualizing gain and phase response efficiently.
Examples & Applications
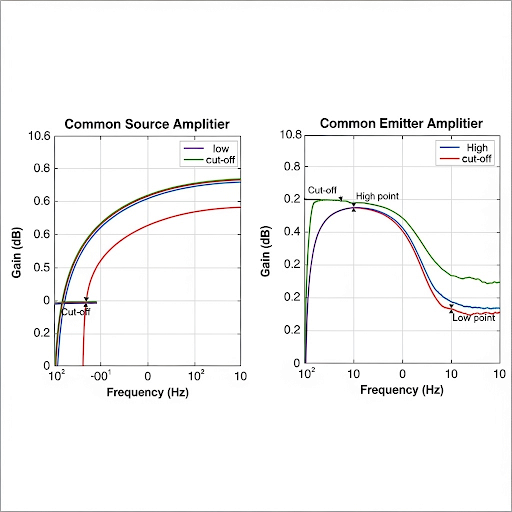
A common emitter amplifier with a frequency response indicates how the gain reduces at low frequencies, while at higher frequencies, gain approaches 1.
Using an RC circuit's transfer function to derive its cutoff frequency helps in calculating the behavior of an amplifier circuit.
Memory Aids
Interactive tools to help you remember key concepts
Rhymes
For CE and CS, the frequencies flow, Gain up high, while lows won't show!
Stories
Once in a circuit land, the mighty CE and CS ruled frequency responses. They learned that at certain points, the skies turned -3dB, marking the cutoff for all signal traffic!
Memory Tools
To recall transfer functions, remember e^g= T: Every gain gives transfer.
Acronyms
Remember **BAG**
Bode
Amplifiers
Gain for analyzing frequency responses!
Flash Cards
Glossary
- Common Emitter Amplifier (CE)
A BJT amplifier configuration that provides significant voltage gain and is widely used in amplifying applications.
- Common Source Amplifier (CS)
A MOSFET amplifier type known for its voltage gain, often utilized in various electronic circuits.
- Frequency Response
The output of a system as a function of frequency, showing how gain and phase vary with input frequency.
- Transfer Function
A mathematical representation in the Laplace domain that describes the relationship between input and output of a system.
- Cutoff Frequency
The frequency at which the output power of a system drops to half of the input power, often identified with a -3 dB point.
- Bode Plot
A graphical representation of a system's gain and phase response plotted against frequency on a logarithmic scale.
Reference links
Supplementary resources to enhance your learning experience.