
Data Models in GIS
Enroll to start learning
You’ve not yet enrolled in this course. Please enroll for free to listen to audio lessons, classroom podcasts and take practice test.
Interactive Audio Lesson
Listen to a student-teacher conversation explaining the topic in a relatable way.
Vector Data Model
🔒 Unlock Audio Lesson
Sign up and enroll to listen to this audio lesson

Let's begin with the Vector Data Model. This model uses points, lines, and polygons to represent discrete geographical features. Can anyone give me an example of a feature represented by a point?

A city on a map could be represented as a point.
Exactly! In GIS, a point could represent features like cities or specific landmarks. How about lines?

A road or a river could be represented as a line.
Great example! Lines connect points and can show features like roads and pathways. Lastly, what about polygons?

Polygons can represent areas, like parks or lakes.
Exactly! Polygons are used for area features. Remember, the vector model is beneficial in network analysis and utility mapping because it allows for detailed attribute data to link to each feature.
To recall this, think of the acronym 'PLP' for Points, Lines, and Polygons. Can anyone summarize what we discussed?

The Vector Data Model uses PLP to represent features, where points are for discrete features, lines for connections, and polygons for areas.
Well summarized! Understanding how to utilize the vector data model effectively enhances our GIS applications.
Raster Data Model
🔒 Unlock Audio Lesson
Sign up and enroll to listen to this audio lesson

Now, let's shift our focus to the Raster Data Model. Can anyone explain what kind of data this model represents?
Raster data represents continuous data like elevation or temperature.
Correct! Raster data is stored as a grid of pixels, with each pixel having a value representing a specific attribute. Why do you think this model is useful for environmental modeling?
It allows for detailed analysis of large areas seamlessly, tracking changes over space.
Excellent point. The raster model is versatile for tasks such as terrain analysis or land cover mapping, where continuous data representation is vital. What is a major difference between raster and vector when it comes to data resolution?
Raster data can lose detail since it depends on the resolution of the grid cells.
Exactly! The resolution affects how much detail you can analyze in raster data. To help remember the Raster Data Model, think of the acronym 'RCG' for Raster Cells Grid. Can someone summarize the key points?
The Raster Data Model uses RCG to represent continuous data, stored as grid pixels, useful for environmental modeling, but the resolution can impact detail.
Well done! Understanding both models allows us to choose the right approach for different GIS applications.
Comparison and Applications of Data Models
🔒 Unlock Audio Lesson
Sign up and enroll to listen to this audio lesson
Now that we know the two data models, how would you compare vector and raster in terms of their features?
Vector is for precise locations and connections, while raster is for broader continuous data.
Correct! Vector data is precise, while raster is continuous. In what scenarios do you think each model would be preferred?
Vector would be better for urban planning where precise locations are required, and raster for analyzing climate changes over large areas.
Great distinction! Urban plans might need the accuracy of vector data, while raster data excels in environmental monitoring. Can anybody think of specific applications for each model?
Vector is great for mapping roads, and raster could be used to analyze rainfall patterns over a region.
Perfect examples! Remember: Vector for network mapping; Raster for environmental analysis. To summarize, vector models work well for discrete features while raster models excel in continuous data analysis.
They have distinct strengths depending on whether precision or continuous data is more vital.
Exactly! Knowing when to employ each data model is essential to effectively analyze geographical information.
Introduction & Overview
Read summaries of the section's main ideas at different levels of detail.
Quick Overview
Standard
Data Models in GIS focuses on the vector and raster data models, explaining how vector data uses points, lines, and polygons to represent discrete features, while raster data represents continuous data in grid formats. Each model plays a crucial role in various GIS applications.
Detailed
Data Models in GIS
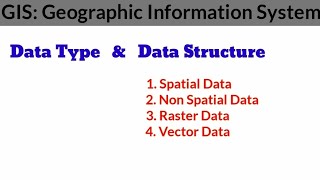
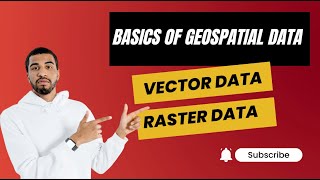
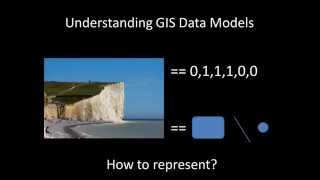
In Geographic Information Systems (GIS), two fundamental data models are used to represent spatial information: Vector Data Model and Raster Data Model.
6.4.1 Vector Data Model
The Vector Data Model stores data in the form of discrete geometric features represented as points, lines, and polygons. Each geometric feature can be associated with a table of attribute data, which provides additional information about the feature. This model is particularly effective for precisions mapping tasks such as network analysis, land use planning, and utility mapping.
6.4.2 Raster Data Model
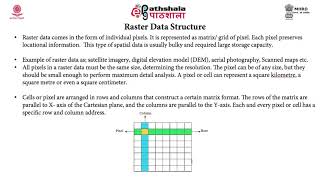
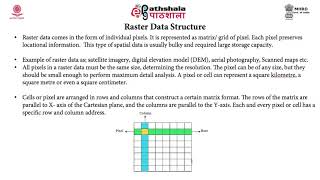
On the other hand, the Raster Data Model is used for continuous data representation, such as elevation or temperature, where data is organized in a grid of cells or pixels. Each cell contains a value representing a point in space, making it suitable for applications in environmental modeling, terrain analysis, and applications requiring seamless data coverage.
Understanding these data models is essential for effective data representation and analysis in GIS applications, influencing how spatial data is visualized and processed.
Youtube Videos


Audio Book
Dive deep into the subject with an immersive audiobook experience.
Vector Data Model
Chapter 1 of 2
🔒 Unlock Audio Chapter
Sign up and enroll to access the full audio experience
Chapter Content
Vector Data Model
- Uses points, lines, and polygons to represent discrete features.
- Each feature is associated with a table containing attribute data.
- Suitable for network analysis, land use, utilities mapping.
Detailed Explanation
The Vector Data Model is a fundamental way of representing geographic features in GIS. In this model, discrete features are represented as points, lines, and polygons. Points can show locations like cities, lines can represent roads or rivers, and polygons can signify areas such as lakes or park boundaries. Each of these features can have associated attribute data, which contains relevant information about the feature—such as the name of a city, the length of a road, or the area of a park. This model is particularly useful for applications where precise boundaries and relationships are important, such as in land use planning or infrastructure mapping.
Examples & Analogies
Imagine a city map. The locations of schools can be marked as points, the roads connecting them as lines, and the parks as shaded areas (polygons). Each school (point) might have attributes like its name, the grades it serves, and its principal's name. This way of organizing data allows city planners to analyze the school's accessibility based on road networks (lines) and the area's usage (polygons).
Raster Data Model
Chapter 2 of 2
🔒 Unlock Audio Chapter
Sign up and enroll to access the full audio experience
Chapter Content
Raster Data Model
- Represents continuous data like elevation, temperature.
- Data is stored in a matrix of cells or pixels.
- Useful for environmental modeling and terrain analysis.
Detailed Explanation
The Raster Data Model is another core method for organizing geographic information. In this model, data is represented in a grid format, which consists of rows and columns of cells, each containing a value that represents a specific attribute. For example, elevation data can be represented as a series of pixels where each pixel's value indicates the height at that location. This model is particularly effective for representing continuous data, such as environmental variables (like temperature, humidity, or vegetation density) across a landscape. It allows for analysis of patterns and changes across large areas.
Examples & Analogies
Think of raster data like a high-resolution photograph. Each pixel in the photo has a color that represents a specific point in the real world. In the case of elevation data, instead of colors, each pixel would have a number indicating how high that point is above sea level. Environmental scientists can use this data to model how temperature changes across a region or to identify areas that may be prone to flooding based on topography.
Key Concepts
-
Vector Data Model: Represents discrete geographic features using points, lines, and polygons.
-
Raster Data Model: Represents continuous data as a grid of pixels.
-
Attribute Data: Descriptive information linked to geographical features.
-
GIS: A system that integrates hardware and software for geographical data management.
Examples & Applications
An example of a vector feature is a city represented as a point; a river as a line, and a national park as a polygon.
An example of raster data is elevation data represented in a digital elevation model, where each pixel represents a specific elevation value.
Memory Aids
Interactive tools to help you remember key concepts
Rhymes
Vector shapes are points and lines, polygons too, that define design!
Stories
Once in a land of maps and data, two friends lived, Vector and Raster. Vector loved to point, line, and border, while Raster enjoyed filling every order with seamless grids and colors galore!
Memory Tools
For the Vector model, remember 'PLP' – Points, Lines, Polygons to represent features.
Acronyms
Use 'RCG' – Raster Cells Grid, to recall how raster data is structured.
Flash Cards
Glossary
- Vector Data Model
A data model that represents geographic features as discrete points, lines, and polygons.
- Raster Data Model
A data model representing continuous data in the form of a matrix of cells or pixels.
- Attribute Data
Non-spatial data associated with features in GIS, providing descriptive information.
- GIS
Geographic Information Systems; computer-based systems for capturing, storing, analyzing, and visualizing spatial data.
Reference links
Supplementary resources to enhance your learning experience.