
GIS and Disaster Management
Enroll to start learning
You’ve not yet enrolled in this course. Please enroll for free to listen to audio lessons, classroom podcasts and take practice test.
Interactive Audio Lesson
Listen to a student-teacher conversation explaining the topic in a relatable way.
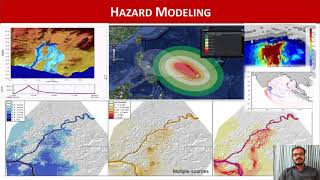
Hazard Mapping
🔒 Unlock Audio Lesson
Sign up and enroll to listen to this audio lesson

Today, we are going to dive into how GIS contributes to hazard mapping in disaster management. Can anyone tell me why mapping hazard-prone areas is essential?

I think it's important so we can avoid building in those areas.
That's absolutely correct! By identifying flood zones or earthquake fault lines, we can create zoning regulations that help keep our communities safe. This is what we refer to as hazard mapping.

How do we gather all that information for the maps?
Great question! We gather data from various sources—like satellite imagery and historical data—and input it into GIS systems. Remember the acronym H.A.Z.A.R.D - Hazard Assessment using Zoning and Aerial Reconnaissance Data, which highlights the importance of comprehensive mapping.

I see! So, the better the maps, the safer our development planning can be?
Exactly! Hazard mapping enables safer urban planning and significantly impacts disaster preparedness.
In summary, hazard mapping is critical for urban development. It helps ensure that we create safe spaces for our communities through careful analysis of geographical risks.
Emergency Response
🔒 Unlock Audio Lesson
Sign up and enroll to listen to this audio lesson

Now, let’s explore how GIS assists in emergency response during a disaster. Who can share how they think GIS might help in these scenarios?

Maybe it can track where all the emergency teams are?
You got it! GIS allows us to monitor the real-time location of rescue teams, which is crucial during emergencies. It can also optimize evacuation routes.
How does it do that?
GIS uses network analysis to calculate the most efficient paths out of disaster zones. Here’s a memory aid: think of ‘R.E.S.C.U.E’ - Real-time Emergency Support through Connected Units and Evacuations.
So, if there's a fire, we can direct people quickly to safety?
Exactly! GIS's fast data processing enables tactical responses that save lives during crisis situations. In summary, GIS plays an integral role in emergency response, enhancing not just speed but effectiveness.
Post-Disaster Assessment
🔒 Unlock Audio Lesson
Sign up and enroll to listen to this audio lesson
After a disaster strikes, what do you think needs to happen immediately?
We need to check the damages!
Exactly! This brings us to post-disaster assessment. GIS can conduct damage assessments efficiently using satellite imagery to analyze affected areas. Can anyone guess how this can help?
It helps decide where to allocate resources?
Spot on! By identifying the most severely affected areas, organizations can prioritize repairs and allocate resources effectively. Here’s a rhyme to remember this: 'Assess the damage, save the day; GIS leads the way to replan and stay!'
So we can recover faster?
Exactly. The quicker we assess damage, the better we can facilitate recovery efforts. In essence, GIS facilitates timely post-disaster assessments, which streamline the recovery process.
Integration with Early Warning Systems
🔒 Unlock Audio Lesson
Sign up and enroll to listen to this audio lesson
Our last topic involves how GIS integrates with early warning systems. Why do you think early warnings are essential?
To prepare communities before a disaster hits!
Exactly! GIS enhances these systems by visualizing risk exposure areas and integrating real-time sensor data. Can anyone think of an example of a disaster that might require this?
Floods, maybe?
Correct! GIS can provide alerts about floods based on sensor data. Here’s a mnemonic: 'F.A.S.T' - Flood Alerts through Sensor Tracking, to remind us of its function in disaster readiness.
So it helps communities to evacuate before a disaster?
Yes! The integration ensures that people are informed and prepared ahead of time. Remember, GIS not only helps us react to disasters but also prepares us proactively to minimize risk.
Introduction & Overview
Read summaries of the section's main ideas at different levels of detail.
Quick Overview
Standard
Geographical Information Systems (GIS) are crucial in disaster management, enabling effective hazard mapping, emergency response, post-disaster assessment, and integration with early warning systems. By leveraging spatial data, GIS aids in planning and executing strategies that improve disaster resilience.
Detailed
GIS and Disaster Management
GIS, or Geographic Information Systems, serves a pivotal role in disaster management across four critical phases: mitigation, preparedness, response, and recovery. Effective use of GIS enables agencies to strategize based on spatial data, enhancing decision-making.
Key Areas of GIS Application in Disaster Management:
- Hazard Mapping: GIS is employed to accurately map hazard-prone areas such as flood zones, landslides, and earthquake fault lines. This mapping aids in developing zoning regulations and ensuring safer urban development.
- Emergency Response: During disasters, GIS enables real-time tracking of rescue teams and optimizes evacuation routes through network analysis, ensuring timely and effective responses.
- Post-Disaster Assessment: After a disaster strikes, GIS can conduct satellite-based damage assessments on infrastructure, vegetation, and housing. This analysis informs rehabilitation strategies and resource allocation, leading to efficient recovery efforts.
- Integration with Early Warning Systems: GIS enhances early warning systems by visualizing risk exposure areas and integrating real-time sensor data. This timely information allows communities to prepare and respond to impending disasters effectively.
Through these applications, GIS not only aids in direct disaster management but also contributes significantly to building disaster resilience in communities.
Youtube Videos


Audio Book
Dive deep into the subject with an immersive audiobook experience.
Role of GIS in Disaster Management
Chapter 1 of 5
🔒 Unlock Audio Chapter
Sign up and enroll to access the full audio experience
Chapter Content
GIS plays a crucial role in all four phases of disaster management: mitigation, preparedness, response, and recovery.
Detailed Explanation
This chunk introduces the critical function of GIS in disaster management. Disaster management is typically divided into four phases: mitigation (reducing the impact of disasters), preparedness (planning for disasters), response (acting during disasters), and recovery (returning to normalcy after a disaster). GIS is integrated into each of these phases by providing geographical insights and data analysis that can enhance decision-making and efficiency.
Examples & Analogies
Think of a city preparing for a hurricane. GIS can be used to identify which areas are most at risk (mitigation), make plans for evacuating residents (preparedness), help coordinate emergency services during the storm (response), and analyze damage to roads and buildings afterward to streamline recovery efforts.
Hazard Mapping with GIS
Chapter 2 of 5
🔒 Unlock Audio Chapter
Sign up and enroll to access the full audio experience
Chapter Content
Hazard mapping involves mapping flood zones, landslide-prone areas, earthquake fault lines. Helps in zoning regulations and safe urban development.
Detailed Explanation
Hazard mapping is the process of identifying and documenting areas that are at risk for specific types of disasters, such as floods, landslides, or earthquakes. GIS allows these hazard zones to be mapped using spatial data, which assists in urban planning by ensuring that new developments are not constructed in high-risk areas. These maps provide essential information for city planners and emergency service providers to make informed decisions.
Examples & Analogies
Consider a school district that wants to build a new school. By using GIS to check that the location is outside of flood zones and far from earthquake fault lines, the district can ensure the safety of students and staff. It's like checking a map of a hiking trail to avoid dangerous cliffs before setting out on an adventure.
Emergency Response Optimization
Chapter 3 of 5
🔒 Unlock Audio Chapter
Sign up and enroll to access the full audio experience
Chapter Content
Real-time tracking of rescue teams. Optimized evacuation routing using network analysis.
Detailed Explanation
During an emergency, rapid response is vital. GIS enables the real-time tracking of rescue teams and resources. By analyzing geographical data and available routes, GIS can determine the fastest and safest evacuation paths for civilians. This optimization helps ensure that help reaches those in need as quickly as possible, minimizing risk during a disaster.
Examples & Analogies
Imagine a fire breaks out in a city. GIS can help fire departments locate the quickest routes to the fire, while also providing information on building layouts and potential hazards, almost like using a GPS app to find the fastest route home during rush hour traffic.
Post-Disaster Assessment Using GIS
Chapter 4 of 5
🔒 Unlock Audio Chapter
Sign up and enroll to access the full audio experience
Chapter Content
Satellite-based damage analysis (buildings, roads, vegetation). Planning rehabilitation and resource allocation.
Detailed Explanation
After a disaster, assessing the damage is crucial for recovery efforts. GIS can utilize satellite imagery and aerial data to assess the extent of damage to structures and the environment. This helps emergency responders understand where to focus their rehabilitation efforts and how to allocate resources effectively to areas most in need.
Examples & Analogies
After a hurricane, emergency management teams can use GIS to analyze satellite images showing damaged neighborhoods and infrastructure. It's similar to piecing together a jigsaw puzzle—the clearer the image they have of the damage, the better they can direct resources and assistance where it's needed most.
Integration with Early Warning Systems
Chapter 5 of 5
🔒 Unlock Audio Chapter
Sign up and enroll to access the full audio experience
Chapter Content
Real-time sensor data feeds into GIS for flood, storm, or earthquake alerts. Visualization of risk exposure areas.
Detailed Explanation
GIS enhances early warning systems by visualizing real-time data from sensors about weather patterns, seismic activity, and other potential hazards. This data can trigger alerts to communities at risk, allowing for timely evacuations and preparations before disasters strike. By visualizing areas at risk, authorities can better inform the public and streamline emergency responses.
Examples & Analogies
Consider storm chasers who use advanced radar systems to monitor weather. By integrating this data into GIS, communities can receive alerts about impending severe weather. It’s akin to receiving a weather app alert about a storm while preparing an outdoor event, enabling individuals to take preventative measures.
Key Concepts
-
Disaster Management: The coordinated effort to prepare for, respond to, and recover from disasters.
-
Mitigation: Efforts to reduce the severity or impact of disasters.
-
Preparedness: Activities and planning done before a disaster strikes to ensure effective response.
-
Response: Immediate actions taken to safeguard life and property during a disaster.
-
Recovery: Post-disaster efforts to restore the affected area to normalcy.
Examples & Applications
GIS maps showing flood hazard zones that inform local governments about safety regulations.
Using GIS to create evacuation routes that optimize safety during a hurricane.
Memory Aids
Interactive tools to help you remember key concepts
Rhymes
'Assess the damage, save the day; GIS leads the way to replan and stay!'
Stories
Once, during a terrible flood, a town relied on GIS to map safe evacuation routes. This mapping enabled them to save lives and recover quickly. The town learned to prepare better for future storms using GIS.
Memory Tools
Remember R.E.S.C.U.E for Emergency Response: Real-time Emergency Support through Connected Units and Evacuations.
Acronyms
H.A.Z.A.R.D - Hazard Assessment using Zoning and Aerial Reconnaissance Data.
Flash Cards
Glossary
- GIS
Geographical Information System, a technology used to capture, store, analyze, and visualize spatial data.
- Hazard Mapping
The process of identifying and mapping areas prone to natural disasters such as floods, earthquakes, or landslides.
- Emergency Response
Actions taken immediately after a disaster to save lives, protect property, and meet basic human needs.
- PostDisaster Assessment
Evaluation conducted after a disaster to assess the extent of damage and determine recovery needs.
- Early Warning Systems
Systems designed to inform communities in advance of imminent hazards to facilitate timely response.
Reference links
Supplementary resources to enhance your learning experience.